BTC/USD Forex Signal: Double-Bottom Pattern Forms
Bullish view
- Buy the BTC/USD pair and set a take-profit at 118,000.
- Add a stop-loss at 110,000.
- Timeline: 1-2 days.
Bearish view
- Sell the BTC/USD pair and set a take-profit at 110,000.
- Add a stop-loss at 118,000.
(Click on image to enlarge)
Bitcoin price has rebounded in the past few days as investors bought the dip. The BTC/USD pair crossed the important resistance level at 114,000 as investors waited for the upcoming US jobs data and government shutdown news.
Bitcoin price rose and approached the psychological point at $115,000 as investors moved to safe-haven assets. Gold jumped to a record high, while the Swiss franc continued its bullish momentum.
Bitcoin is seen by some investors as a safe-haven asset because of its limited supply and strong demand among investors.
There are a few risks that investors are battling with. First, there is a risk that the US government will be shut down on Wednesday as differences between Democrats and Republicans continue.
A prolonged government shutdown will have an impact on the economy and push the Fed to start cutting interest rates, which is a positive thing for Bitcoin and other cryptocurrencies.
The other key risk is on tariffs, which Trump has continued to add this week. In a statement, he said that the US would apply tariffs on imported furniture and movies made in other countries.
Looking ahead, the BTC/USD pair will react to the upcoming US non-farm payrolls data. This report will come out if the US government shutdown does not happen.
A weak jobs report will raise the possibility that the Federal Reserve cuts interest rates will cut interest rates in the upcoming meeting. Bitcoin normally does well when the Fed is cutting interest rates.
BTC/USD Technical Analysis
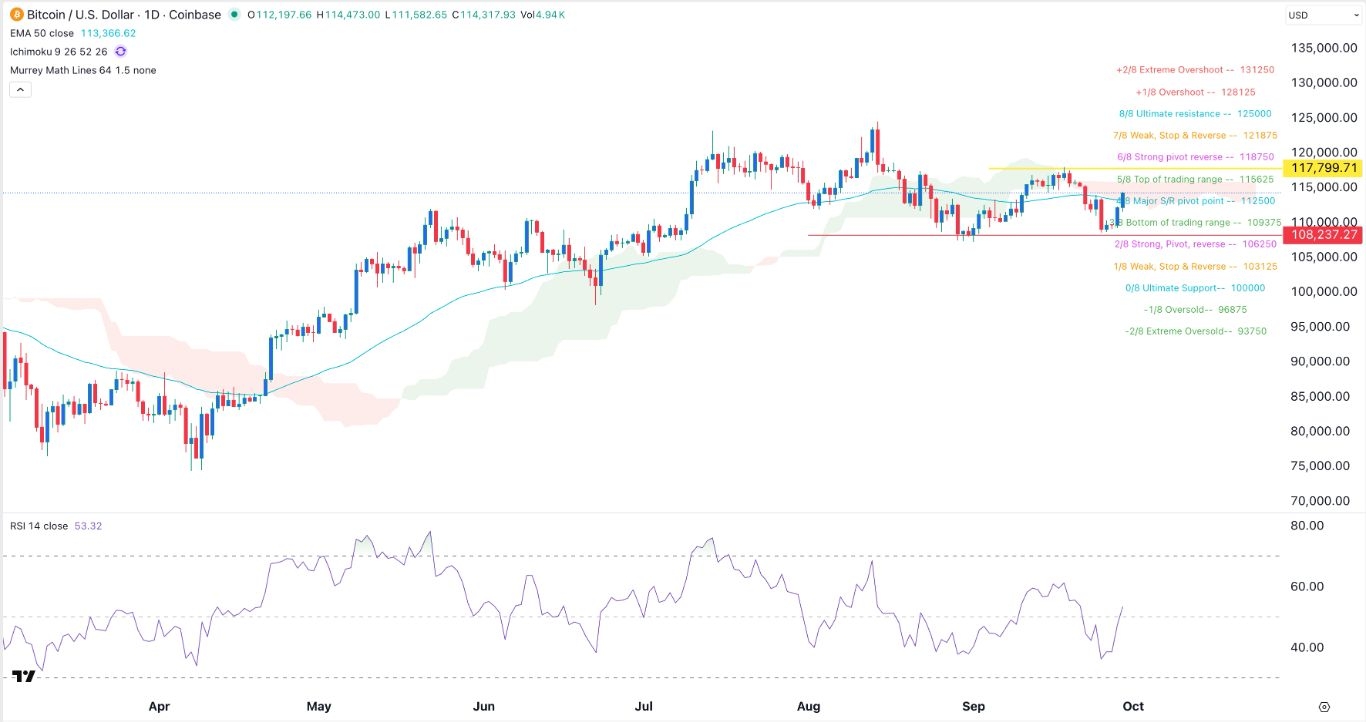
The daily chart shows that the BTC/USD pair has rebounded in the past few days. This rebound happened after the coin formed a double-bottom pattern at 108,237, its lowest level in August and this month.
An asset normally bounces back whenever it forms a double-bottom pattern. Bitcoin price has moved into the Ichimoku cloud indicator. It has also jumped above the 50-day Exponential Moving Average.
Bitcoin has moved above the Major S/R pivot point of the Murrey Math Lines tool. Therefore, it will likely continue doing well, with the next point to watch being the neckline of the double-bottom at 118,000. A move below the double-bottom at 108,240 will invalidate the bullish outlook.
More By This Author:
AUD/USD Forex Signal - Bearish Outlook Ahead Of RBA DecisionWhy Are Bitcoin Treasury Stocks Crashing In 2025?
VOO And SPY ETFs: Top Stocks Driving The S&P 500 Index In 2025
Risk Disclaimer: DailyForex will not be held liable for any loss or damage resulting from reliance on the information contained within this website including market news, analysis, trading signals ...
more


