
Bearish view
- Sell the GBP/USD pair and set a take-profit at 1.3185.
- Add a stop-loss at 1.3425.
- Timeline: 1-2 days.
Bullish view
- Buy the GBP/USD pair and set a take-profit at 1.3425.
- Add a stop-loss at 1.3185.
The GBP/USD exchange rate has pulled back and reached its lowest level since August 1 as traders braced for a renewed trade war between the United States and China. It dropped to a multi-month low of 1.3263, down from the September high of 1.3730.
US Dollar Rises as Risks Jump
The GBP/USD exchange rate remained under pressure as risks to the United States continued. One of the top risks in the market is the ongoing government shutdown, which has entered the third year, with no end in sight.
(Click on image to enlarge)
The government shutdown happened after Democrats and Republicans differed on how to keep the government funded. Democrats have maintained that they will only fund the government if Republicans agree to add provisions on healthcare. Republicans are supporting a clean funding bill.
The other major risk is that the US and China have intensified their trade war. Donald Trump said that the US will place a 130% tariff on Chinese goods in November, citing provocations by Beijing, including limiting the supply of rare earth materials.
The main catalyst for the GBP/USD pair will be the developments on tariffs and the government shutdown. It will also react to the upcoming statements from some Federal Reserve officials.
Meanwhile, the pair will react to the key macroeconomic data from the UK. The first report will come out on Tuesday when the Office of National Statistics (ONS) will publish the latest jobs numbers. Economists expect the numbers to show that the unemployment rate remained unchanged at 4.7%.
The other key data will be the upcoming UK GDP, industrial, and manufacturing production numbers on Friday this week. All these numbers will provide more color on what to expect when the Bank of England meets next.
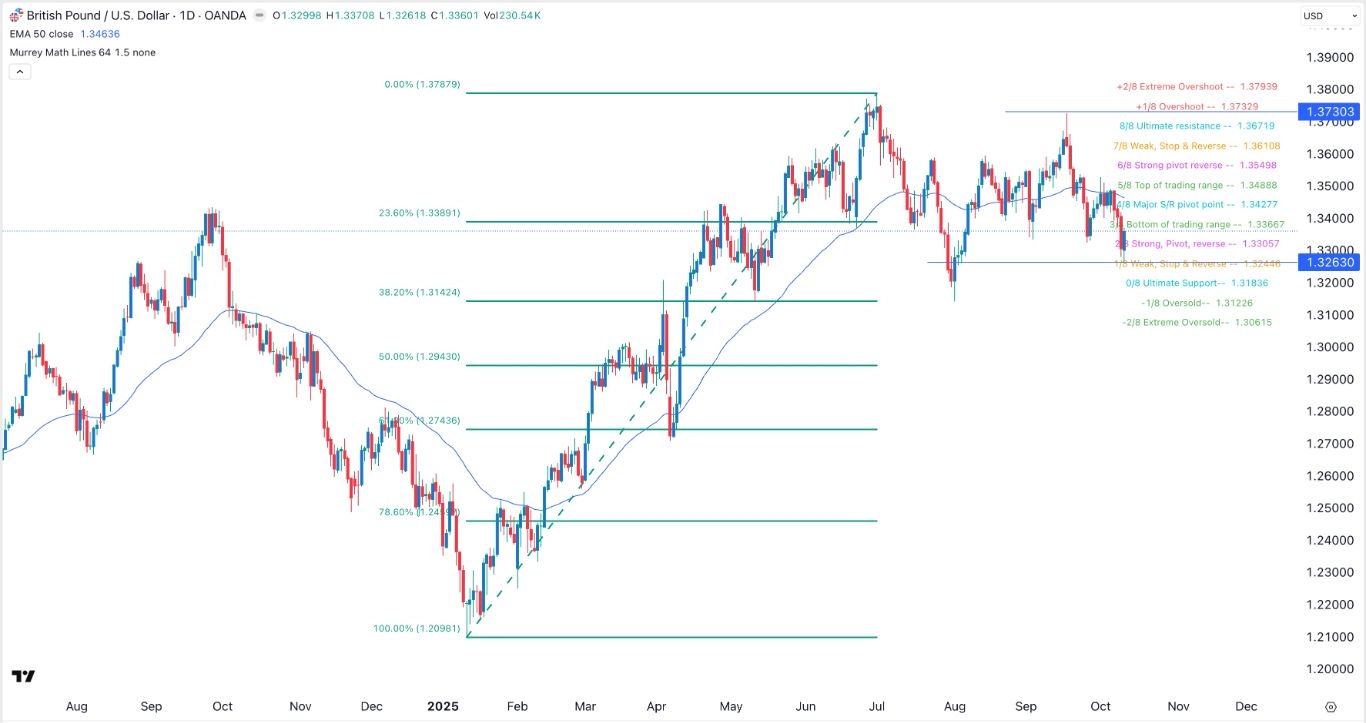
GBP/USD Technical Analysis
The daily timeframe chart shows that the GBP/USD exchange rate has pulled back in the past few weeks, moving from a high of 1.3730 to a low of 1.3360. It has moved below the 23.6% Fibonacci Retracement level.
The pair has dropped below the 50-day Exponential Moving Average (EMA). It is also wavering at the strong, pivot, and reverse of the Murrey Math Lines at 1.3300.
Therefore, the pair will likely continue falling as sellers target the ultimate support at 1.3185. A move above the resistance at 1.3400 will invalidate the bearish outlook.
More By This Author:
Crypto Crash: Will Bitcoin And Other Altcoins Go Back Up?BTC/USD Signal: Bitcoin Price Prepares To Soar Above ATH
BTCUSD Signal: BTC/USD Signal: Bitcoin Price Rally Cools As Shooting Star Forms


Comments
Log in or sign up to join the conversation.