
Bearish view
- Sell the GBP/USD pair and set a take-profit at 1.2955.
- Add a stop-loss at 1.3165.
- Timeline: 1-2 days.
Bullish view
- Buy the GBP/USD pair and set a take-profit at 1.3165.
- Add a stop-loss at 1.2955.
The GBP/USD exchange rate recoiled and slipped sharply overnight after the Federal Reserve published hawkish minutes of the last monetary policy meeting. It dropped to a low of 1.3053, down from the year-to-date high of 1.3800.
Fed Minutes and UK Inflation
The GBP/USD exchange rate resumed its downtrend after the UK released the latest inflation report. Data compiled by the Office of National Statistics (ONS) showed that the headline Consumer Price Index (CPI) slipped from 3.8% in September to 3.6% in October.
The closely-watched core inflation report, which excludes volatile items, dropped to 3.4% from the previous 3.5%, while the Retail Price Index dropped to 4.3% from the previous 4.5%.
These numbers came after a closely-watched Reuters poll noted that most economists believe that the bank will cut interest rates by 0.25% in the next meeting in December this year. Such a cut will aim at supercharging the country’s economic growth as it remains in a stagflation situation.
The GBP/USD exchange rate also reacted to the latest Federal Reserve minutes, which provided more information on what the Federal Reserve did in the last meeting. These minutes showed that officials deliberated in length the merits and demerits of cutting interest rates in the last meeting.
As a result, these minutes cast doubt on whether officials will decide to cut rates in the December meeting. These doubts explain why the US dollar rose after the minutes.
(Click on image to enlarge)
The next key catalyst for the GBP/USD pair will be the upcoming US September jobs data. Economists expect the report to show that the economy added 55k jobs after adding 22k jobs in the previous month. The pair will also react to the upcoming statements by Beth Hammack, Austan Goolsbee, and Lisa Cook.
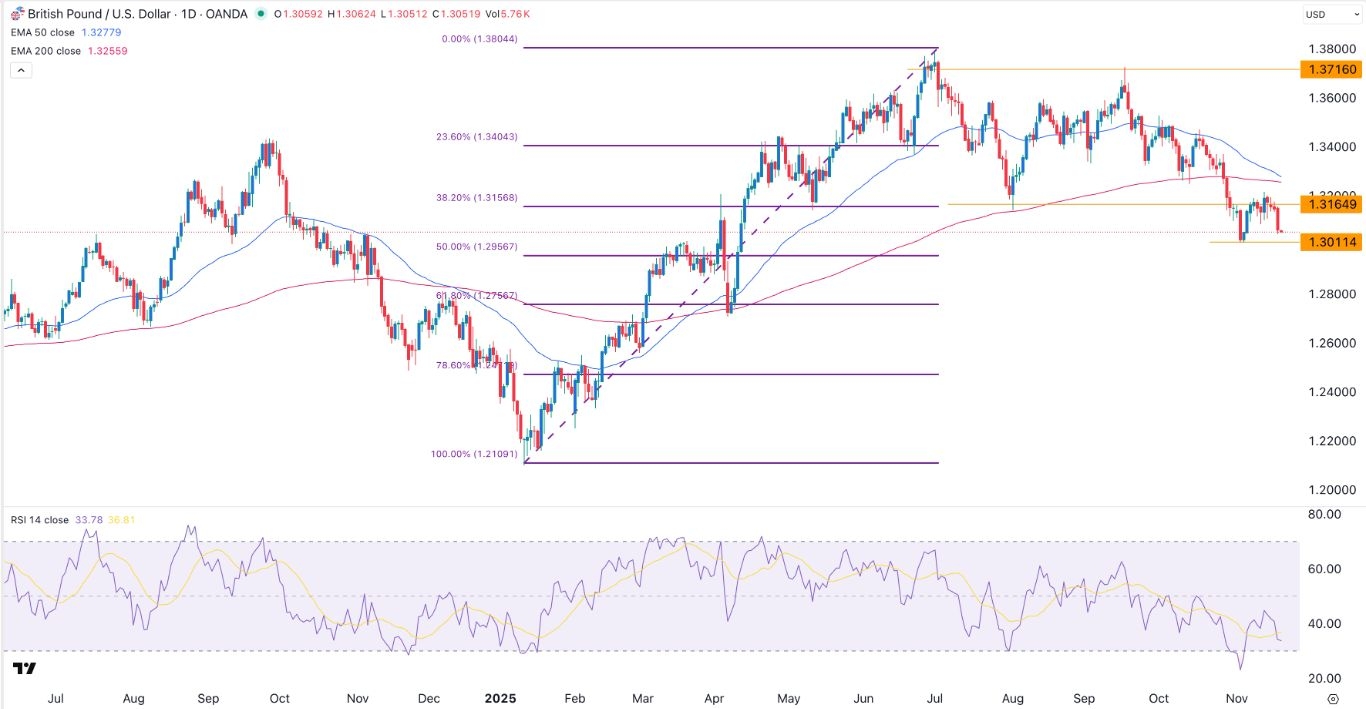
GBP/USD Technical Analysis
The daily timeframe chart shows that the GBP/USD exchange rate has been in a freefall in the past few hours. It dropped to a low of 1.3050 from this week's high of 1.3215.
The pair has moved below the 38.2%Fibonacci Retracement level at 1.3156. It has moved below the Ichimoku cloud indicator, while the spread between the 50-day and 200-day Exponential Moving Averages (EMA) has narrowed. That is a sign that the pair is about to form a death cross, which will lead to more downside.
A drop below the key support at 1.3010 will point to more downside, potentially to the 50% retracement level at 1.2955.
More By This Author:
AUD/USD Forex Signal: Stuck In A Range, But A Bearish Breakout PossibleGBP/USD Forex Signal: Sterling To Retreat As Recovery Hits Key Resistance
BTC/USD Forex Signal: Bitcoin Price Freefall Continues


Comments
Log in or sign up to join the conversation.