

Photo by Colin Watts on Unsplash
- GBP/USD surrenders intraday gains amid dismal market sentiment.
- The Fed seems certain to cut interest rates in September.
- The Pound Sterling will be influenced by UK labor market and inflation data.
The GBP/USD pair surrenders its intraday gains and falls back to near 1.2730 in Friday’s New York session. The Cable comes under pressure amid cautious market mood. The S&P 500 opens with some losses, exhibiting that the risk-appetite of investors is weak.
The US Dollar (USD) consolidates in a tight range, with investors focusing on how much the Federal Reserve (Fed) will reduce interest rates in the September meeting. According to the CME FedWatch tool, 30-day Federal Funds Futures pricing data shows that traders see a 56.5% chance that interest rates will be reduced by 50 bps in September.
Going forward, the next trigger for the US Dollar will be the United States (US) Consumer Price Index (CPI) data for July, which will be published on Wednesday. The inflation data will indicate whether price pressures are on track to return to the desired rate of 2%.
Meanwhile, the Pound Sterling will be influenced by the United Kingdom (UK) Employment data for three-months-ending July and the consumer inflation data for July, which will be published on Tuesday and Wednesday. The economic data will indicate whether the Bank of England (BoE) will deliver subsequent rate cuts in September.
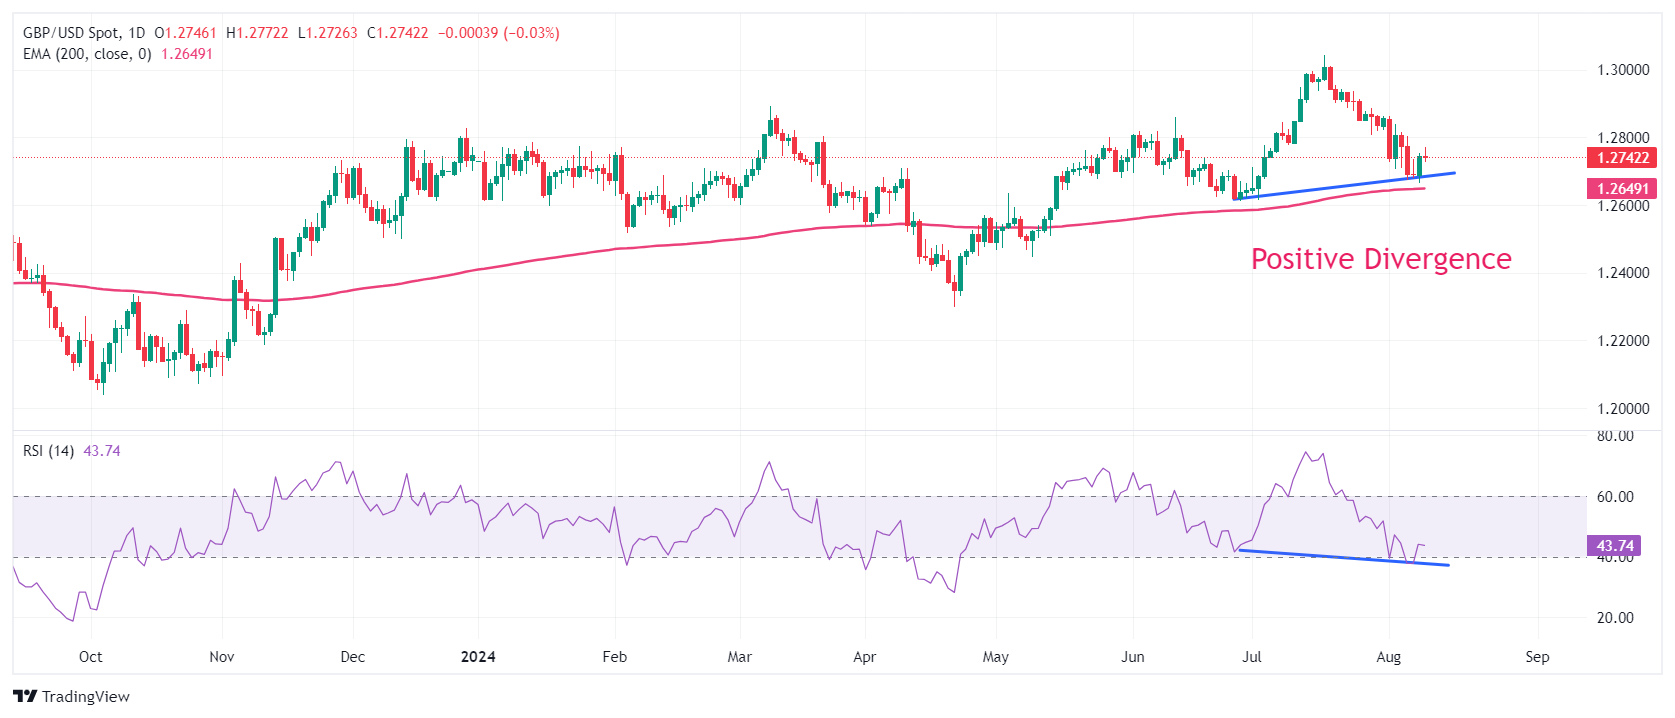
The Cable is at a make or a break below the crucial figure of 1.2700. The major exhibits a Positive divergence formation on a daily timeframe in which the asset continues to build higher lows, while the momentum oscillator makes lower lows. This generally results in a resumption in the uptrend but it should be confirmed with more indicators.
The 14-day Relative Strength Index (RSI) finds cushion near 40.00, exhibiting signs of buying interest at lower levels.
The asset continues to hold the 200-day Exponential Moving Average (EMA), which trades around 1.2650.
More downside could appear if the asset breaks below the intraday low of 1.2665. This would expose the asset to June 27 low at 1.2613, followed by April 29 high at 1.2570.
On the flip side, a recovery move above August 6 high at 1.2800 would drive the asset towards August 2 high at 1.2840 and the round-level resistance of 1.2900.
GBP/USD daily chart
(Click on image to enlarge)
More By This Author:
AUD/JPY Price Forecast: Struggles To Continue Winning StreakUSD/JPY Declines To Near 146.00 On BoJ’s Hawkish Summary Of Opinions
EUR/USD Holds Above 1.0900 While Investors Look For More Cues On Fed-ECB Policy


Comments
Log in or sign up to join the conversation.