GBP/USD Price Analysis: Wavers Below 1.2500 As Bearish Harami Looms
Image Source: Unsplash
- GBP/USD remains steady, slightly down by 0.05% following mixed US PMI data from S&P Global and ISM.
- The two-candle chart pattern, the bearish harami suggests further downside is seen.
- Key support levels lie at the April 29 low of 1.2474 could lead to retesting the yearly low at 1.2299.
The Pound Sterling is virtually unchanged against the US Dollar following the release of mixed Purchasing Managers Index (PMI) data from S&P Global and the Institute for Supply Management (ISM). The data showed that the economy is slowing down, amid higher interest rates set by the Federal Reserve. The GBP/USD seesaws around 1.2486, down 0.05%.
GBP/USD Price Analysis: Technical outlook
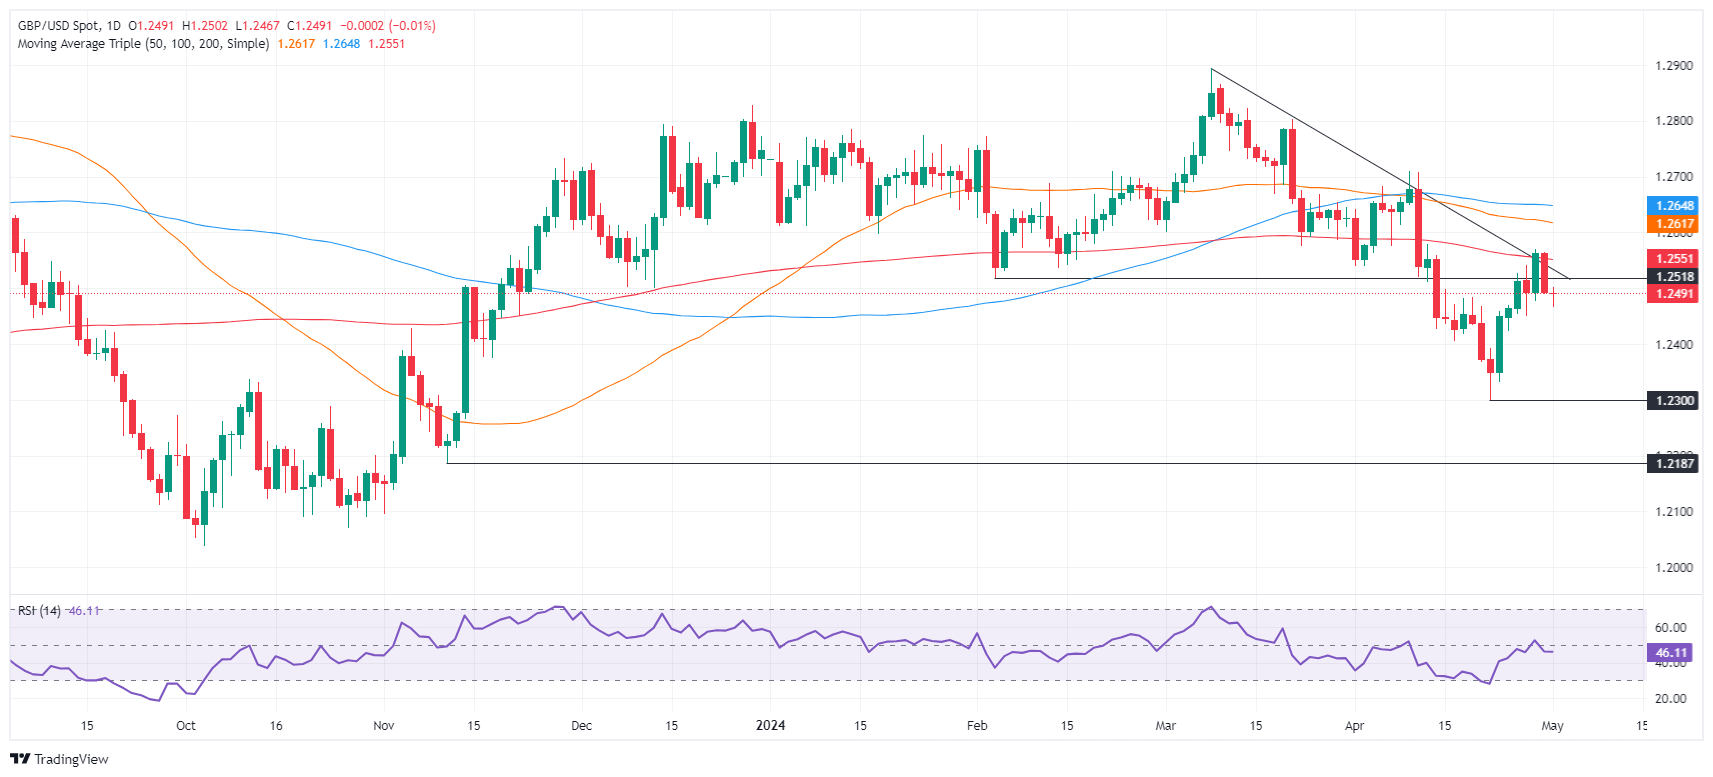
The GBP/USD remains downward biased despite registering an upward impulse that lifted the exchange rate from yearly lows of 1.2299 to April’s high of 1.2569. the advance was capped by strong resistance provided by the 200-day moving average (DMA) at 1.2552, triggering a two-candle bearish formation – bearish harami. This pattern needs a confirmation past the April 29 low of 1.2474, which would exacerbate a test of the latest swing low of 1.2299.
On the other hand, if buyers achieve a daily close above 1.2500, subsequent gains are seen if they challenge the 200-DMA. Once surpassed, the next stop would be the 1.2600 mark.
GBP/USD Price Action – Daily Chart
GBP/USD
| OVERVIEW | |
|---|---|
| Today last price | 1.2491 |
| Today Daily Change | -0.0001 |
| Today Daily Change % | -0.01 |
| Today daily open | 1.2492 |
| TRENDS | |
|---|---|
| Daily SMA20 | 1.2513 |
| Daily SMA50 | 1.262 |
| Daily SMA100 | 1.2649 |
| Daily SMA200 | 1.2553 |
| LEVELS | |
|---|---|
| Previous Daily High | 1.2564 |
| Previous Daily Low | 1.249 |
| Previous Weekly High | 1.2542 |
| Previous Weekly Low | 1.23 |
| Previous Monthly High | 1.2709 |
| Previous Monthly Low | 1.23 |
| Daily Fibonacci 38.2% | 1.2518 |
| Daily Fibonacci 61.8% | 1.2536 |
| Daily Pivot Point S1 | 1.2467 |
| Daily Pivot Point S2 | 1.2442 |
| Daily Pivot Point S3 | 1.2393 |
| Daily Pivot Point R1 | 1.2541 |
| Daily Pivot Point R2 | 1.259 |
| Daily Pivot Point R3 | 1.2615 |
More By This Author:
Silver Price Analysis: XAG/USD Plunges Over 3%, Back Beneath $27.00Silver Price Analysis: XAG/USD Dips Slightly, Remains Bullish Above $27.00
EUR/JPY Price Analysis: Bullish Run Faces Overbought Risks, Hovers Around 169.00
Disclaimer: Information on these pages contains forward-looking statements that involve risks and uncertainties. Markets and instruments profiled on this page are for informational purposes only ...
more


