
- US PCE inflation eased as anticipated in November, Durable Goods Orders disappointed.
- GBP/USD is struggling to retain the 1.2000 mark as US Dollar demand increases.
- US Dollar demand increases ahead of the long weekend.
Following a short-lived slide to 1.2022, a fresh daily low, GBP/USD trimmed losses and flirted with daily highs. It currently trades in the 1.2040 price zone as speculative interest is still digesting mixed United States macroeconomic figures. On the one hand, the Personal Consumption Expenditures (PCE) Price Index rose by 5.5% YoY in November from 6.1% in October, further indicating easing inflationary pressures in the country.
On the other, Durable Goods Orders in the same month unexpectedly declined by a whopping 2.1% MoM, much worse than the 0.6% decline anticipated by market players. However, the core reading, Nondefense Capital Goods Orders ex Aircraft, rose 0.2%, better than the unchanged reading expected.
US Dollar initially appreciated with the news, then turned south, now rallying again on the back of fresh weekly highs in Treasury yields. The yield on the 10-year note jumped to 3.728%, its highest for December, while the -year note yield advanced to 4.327%. Yields held on to gains ahead of Wall Street’s opening, while US indexes are poised to open with modest gains, following the lead of their overseas counterparts.
Meanwhile, the British Pound remains weak after the latest macroeconomic releases confirmed the United Kingdom is suffering a recession that will likely extend well into 2023.
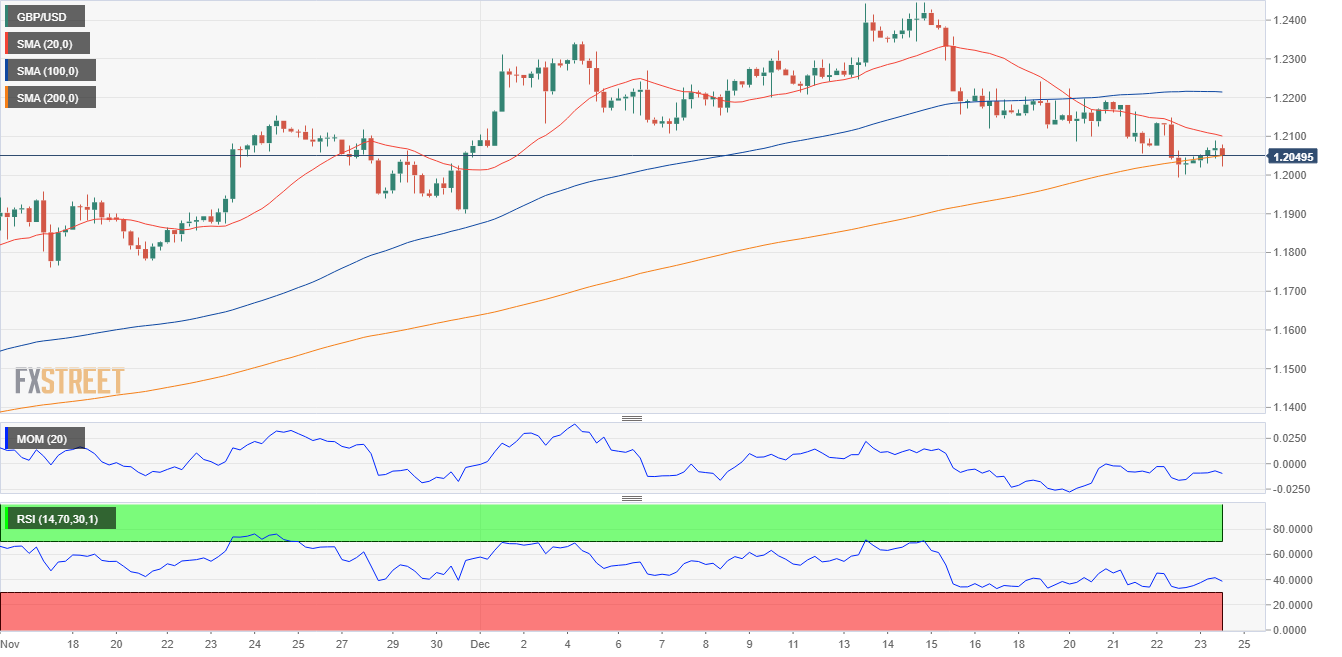
GBP/USD technical perspective
GBP/USD is little changed on a daily basis as winter holidays kicked in, limiting volumes. Technical readings in the daily chart hint at further declines ahead s the pair develops below a bearish 200 SMA after breaking below it on Thursday. Technical indicators, in the meantime, develop within negative levels, lacking evident directional strength but showing no signs of bearish exhaustion and far above oversold readings.
The weekly low at 1.1991 is the immediate near-term support level, en route to 1.1950. A daily close near the latter could anticipate a steeper decline next week. Sellers are adding shorts at around 1.2080, the immediate resistance level, followed by 1.2140.
(Click on image to enlarge)
GBP/USD
| OVERVIEW | |
|---|---|
| Today last price | 1.2044 |
| Today Daily Change | 0.0003 |
| Today Daily Change % | 0.02 |
| Today daily open | 1.2041 |
| TRENDS | |
|---|---|
| Daily SMA20 | 1.2172 |
| Daily SMA50 | 1.1812 |
| Daily SMA100 | 1.1672 |
| Daily SMA200 | 1.2081 |
| LEVELS | |
|---|---|
| Previous Daily High | 1.2147 |
| Previous Daily Low | 1.1992 |
| Previous Weekly High | 1.2447 |
| Previous Weekly Low | 1.212 |
| Previous Monthly High | 1.2154 |
| Previous Monthly Low | 1.1147 |
| Daily Fibonacci 38.2% | 1.2052 |
| Daily Fibonacci 61.8% | 1.2088 |
| Daily Pivot Point S1 | 1.1973 |
| Daily Pivot Point S2 | 1.1906 |
| Daily Pivot Point S3 | 1.1819 |
| Daily Pivot Point R1 | 1.2128 |
| Daily Pivot Point R2 | 1.2215 |
| Daily Pivot Point R3 | 1.2283 |
More By This Author:
GBP/USD Trades With Modest Gains Around Mid - 1.2000s, Eyes US PCE For Fresh Impetus
NZD/USD Sticks To Modest Intraday Gains Above 0.6300 Amid Softer USD, Positive Risk Tone
Gold Price Forecast: XAU/USD Consolidates Below Multi-Month Top, Bullish Potential Intact


Comments
Log in or sign up to join the conversation.