GBP/USD Price Analysis: Holds Firm Amid Hot UK Inflation
- The GBP/USD price analysis shows the pound steady against the dollar.
- Data on Wednesday revealed that inflation in the UK remained high at 3.8% in August.
- Market participants are anticipating a more dovish Fed.
The GBP/USD price analysis shows the pound steady against the dollar as UK inflation remains high. Market participants expect Bank of England policymakers to keep rates unchanged this week. Meanwhile, the dollar continued its drop ahead of the FOMC meeting, where policymakers will likely cut rates by 25-bps.
Data on Wednesday revealed that inflation in the UK remained high at 3.8% in August. The figure came in line with expectations and solidified the view that the BoE will be cautious at this week’s meeting. At the same time, market participants expect only one rate cut before the year ends.
“In line inflation print is unlikely to move the needle on the BoE’s interest rates decision tomorrow,” said Emma Mogford, fund manager at Premier Miton Monthly Income Fund.
“Consumers and businesses will have to wait a bit longer for an interest rate cut.”
On the other hand, markets are anticipating a more dovish Fed. Recent employment figures have increased expectations for rate cuts this year, weighing on the dollar. Even upbeat retail sales data in the previous session could not dampen these expectations. If the Fed delivers a less dovish meeting, he greenback could recover. On the other hand, unexpected dovishness would allow the pound to extend its rally.
GBP/USD key events today
- FOMC policy meeting
GBP/USD technical price analysis: Eyeing 1.3700 after key resistance breakout
(Click on image to enlarge)

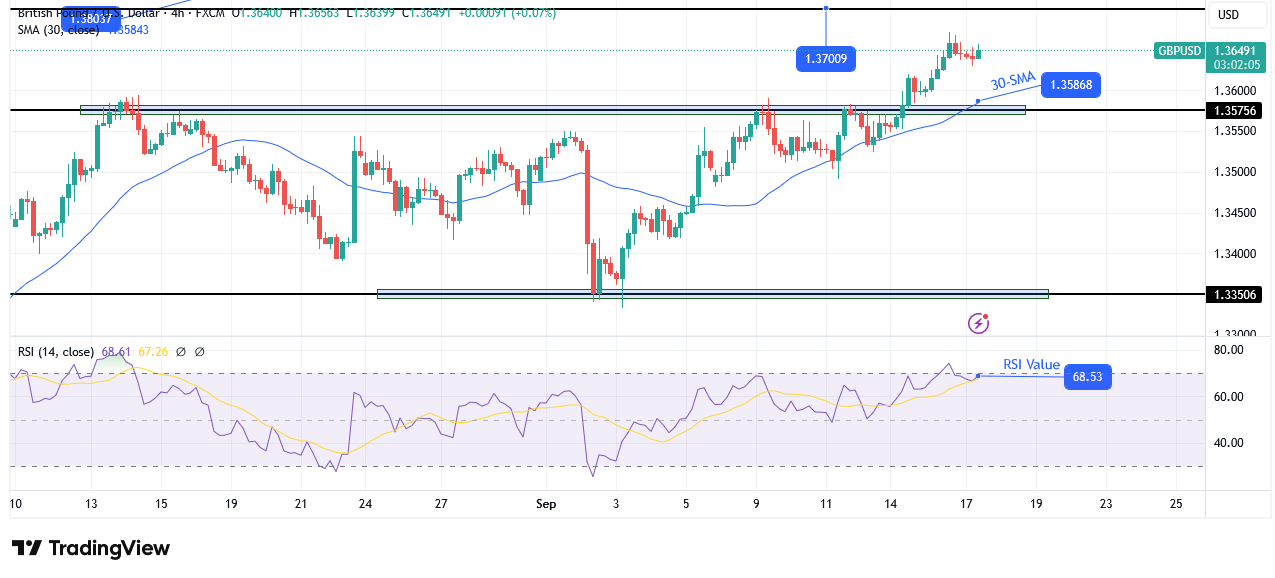
GBP/USD 4-hour chart
On the technical side, the GBP/USD price recently broke above the 1.3575 key resistance level, solidifying the bullish bias. Currently, it trades well above the SMA, with the RSI near the overbought region. At the same time, the price has made a higher high, developing the pattern of a bullish trend.
Previously, the price had struggled to break above the 1.3575 level. However, after several attempts, bulls broke above and are aiming for the next resistance at the 1.3700 level. Before the price reaches this level, however, it could pull back to retest the recently broken resistance. At the same time, a pullback would allow GBP/USD to retest the 30-SMA before climbing higher.
A break above the 1.3700 resistance would strengthen the bullish bias. Moreover, the trend would continue as long as the price stays above the 30-SMA and the RSI is above 50.
More By This Author:
GBP/USD Outlook: Soars As Traders Brace For Policy MovesUSD/CAD Forecast: Dollar Fragile As Markets Position For Fed Cut
USD/CAD Weekly Forecast: Markets Brace For Boc, Fed Cuts
Disclaimer: Foreign exchange (Forex) trading carries a high level of risk and may not be suitable for all investors. The risk grows as the leverage is higher. Investment objectives, risk ...
more


