GBP/USD Forex Signal: Sterling Rally Has More Room To Run
Bullish view
- Buy the GBP/USD pair and set a take-profit at 1.3000.
- Add a stop-loss at 1.2775.
- Timeline: 1-2 days.
Bearish view
- Set a sell-stop at 1.2855 and a take-profit at 1.2800.
- Add a stop-loss at 1.3000.
(Click on image to enlarge)
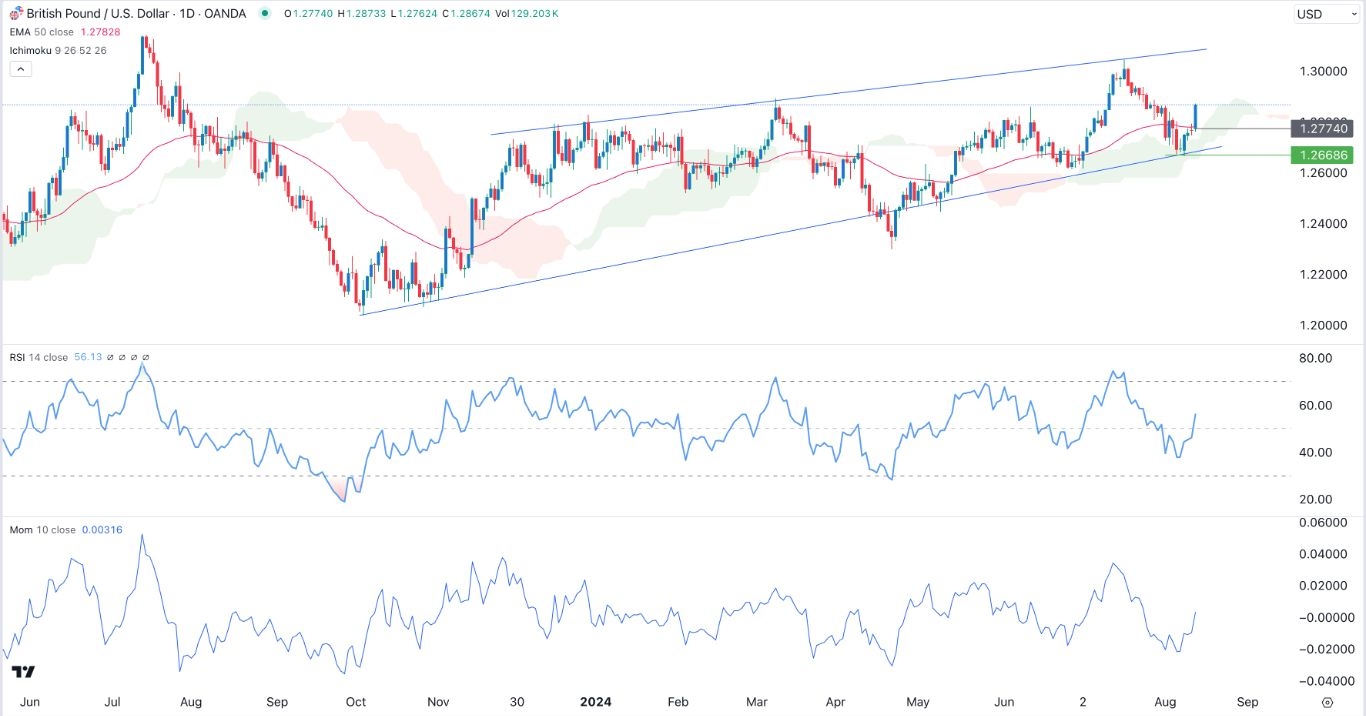
The GBP/USD currency pair rallied as the US dollar index retreated by more than 0.50% after the encouraging Producer Price Index (PPI) report. It rose to 1.2865, its highest point since July 25 ahead of the US and UK inflation numbers.
US and UK inflation report
The GBP/USD exchange rate rose after the US released the latest PPI report. In a report, the Bureau of Labor Statistics (BLS) said that producer prices retreated in July. The PPI fell from 0.2% in June to 0.1%, lower than the median estimate of 0.2%. It moved from 2.7% to 2.2% on an annual basis.
The core PPI, which excludes volatile items, retreated from 0.3% to 0.0% in July, leading to an annual drop to 2.4%. These numbers led to a sharp decline of the US dollar, which moved from $102.65 to $102.38 as hopes of a Federal Reserve cut rose.
In a statement, Raphael Bostic, one of the most hawkish Fed members said that he would be supportive of a rate cut in the fourth quarter.
Looking ahead, the GBP/USD pair will react to the upcoming UK and US consumer price index (CPI) data. In the US, analysts expect that the headline CPI rose from minus 0.1% in June to 0.2% in July while the core CPI rose from 0.1% to 0.2%.
The GBP/USD exchange rate will also react to the upcoming UK inflation numbers. The headline CPI is expected to come in at 2.3% in July from the previous 2.0% while the core CPI moved from 3.5% to 3.4%. A strong inflation report while likely have an impact on the Bank of England, which has started cutting interest rates.
GBP/USD technical analysis
The GBP/USD exchange rate bottomed at 1.2670 on August 8 and bounced back to 1.2865, its highest point on July 29. On the daily chart, the pair moved above the 50-day moving average while the Relative Strength Index (RSI) moved above 50 and was pointing upwards.
The pair rose above the Ichimoku cloud indicator while the momentum oscillator has also risen. Therefore, the pair will likely continue rising as buyers target the psychological point at 1.3000. The stop-loss of this trade will be at 1.2775.
More By This Author:
AUD/USD Forex Signal: Gains Momentum Ahead Of US Inflation DataBTC/USD Forex Signal: Bitcoin Under Intense Pressure
AUD/USD Forex Signal: Inverse Head and Shoulders Forms
Disclosure: DailyForex will not be held liable for any loss or damage resulting from reliance on the information contained within this website including market news, analysis, trading signals ...
more


