GBP/USD Forex Signal: Start Of A Prolonged Sterling Crash
Bearish view
- Sell the GBP/USD pair and set a take-profit at 1.3300.
- Set a take-profit at 1.3600.
- Timeline:1-2 days.
Bullish view
- Buy the GBP/USD pair and set a take-profit at 1.3600.
- Add a stop-loss at 1.330.
(Click on image to enlarge)
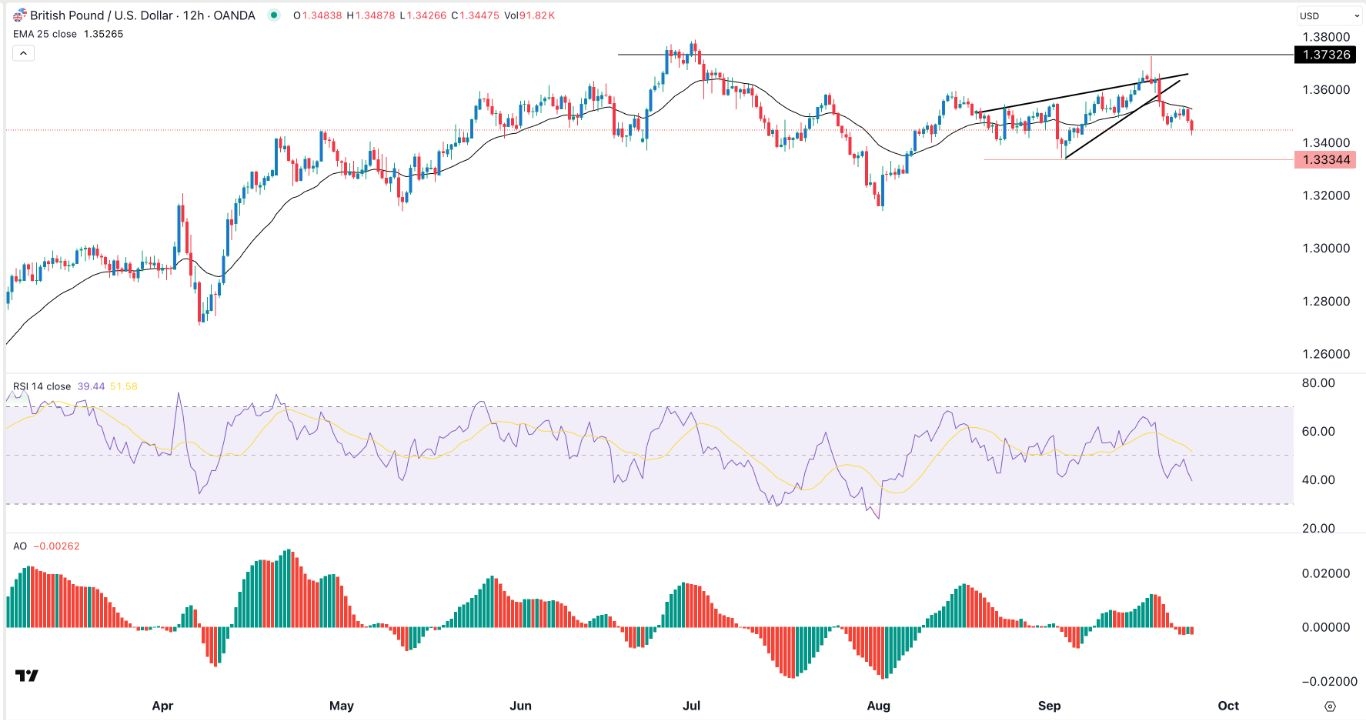
The GBP/USD pair crashed as the US dollar jumped across the board after the US released strong housing numbers. It also plunged as traders reacted to the upcoming US GDP and PCE economic numbers. It moved to a low of 1.3445, its lowest level since September 5.
US GDP and PCE Data Ahead
The GBP/USD pair plunged after the US released strong housing numbers. New home sales soared by 20% in August, helped by the relatively low mortgage rates and discounts from home builders.
This report showed that the housing sector is doing well, a trend that may continue now that the Fed has started to cut interest rates. Recent data shows that mortgage rates have dropped sharply from the highest point this year.
The US will publish the final estimate of the second-quarter GDP data. Based on the last report, analysts expect the data to show that the economy expanded by over 3.2% in Q2. Historically, this third estimate does not have a major impact on the US dollar.
The next important data that may have some impact on the GBP/USD will be the upcoming US PCE report on Friday. This is a key report that looks at price changes in the rural and urban areas and is the Fed’s favorite inflation gauge.
However, the GBP/USD pair will likely react mildly to the PCE report because Fed officials are now focusing in the labor market. Recent reports showed that the economy created just 22,000 jobs in August and the unemployment rate rose to 4.3%.
Meanwhile, in the UK, the central bank is dealing with stagflation, which happens when a country has high inflation and slow GDP growth. The headline inflation in the UK stands at over 3.6% and is trending upwards, meaning that the BoE will maintain its interest rates.
GBP/USD Technical Analysis
The GBP/USD pair has crashed from thi month’s high of 1.3732 to the current 1.3445, its lowest point in almost three weeks. This decline is happening as the US dollar index rebounds.
The pair formed a rising wedge pattern, which often leads to more downside. It has already moved below the 25 period Exponential Moving Average and the lower side of the wedge pattern.
Also, the Relative Strength Index has moved below 50, while the Awesome Oscillator has moved below the zero line. Therefore, the pair will likely continue falling as sellers target the key support at 1.3300.
More By This Author:
Reddit Stock Price Forecast: Pattern Points To A RDDT SurgeEUR/USD Signal: Uptrend To Continue As Traders Digest Next Fed Action
BTC/USD Forex Signal: Bitcoin Crash Gains Steam As H&S Forms
Risk Disclaimer: DailyForex will not be held liable for any loss or damage resulting from reliance on the information contained within this website including market news, analysis, trading signals ...
more


