GBP/USD Forex Signal: Nears Bearish Breakout Ahead Of UK Budget
Bearish view
- Sell the GBP/USD pair and set a take-profit at 1.2950.
- Add a stop-loss at 1.3200.
- Timeline: 1-2 days.
Bullish view
- Buy the GBP/USD pair and set take-profit at 1.3200.
- Add a stop-loss at 1.2950.
(Click on image to enlarge)

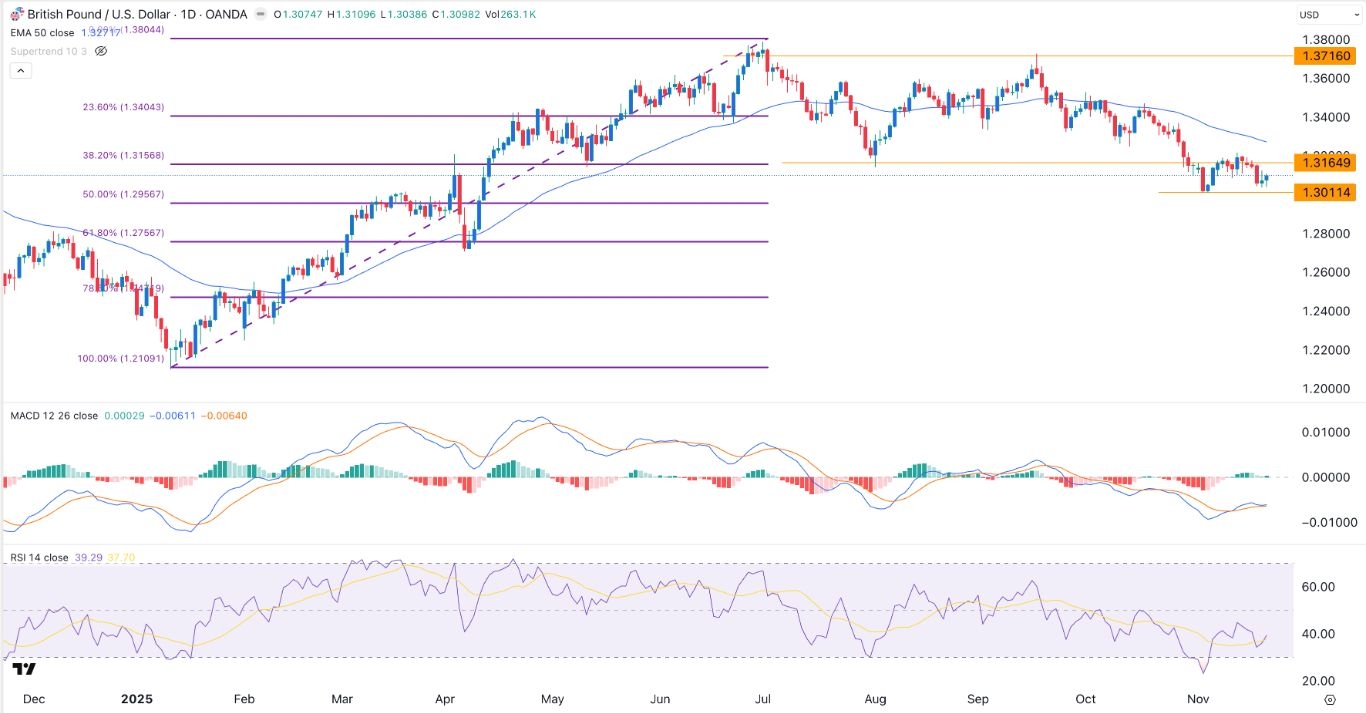
The GBP/USD exchange rate remained in a downward trend after a series of economic numbers from the UK and the United States. It moved to the key support at 1.3100, down sharply from the year-to-date high of 1.3715.
UK Inflation and Retail Sales and Impact on BoE
The GBP/USD exchange rate has remained under pressure in the past few months as the US dollar index continued rising.
It reacted to the UK consumer inflation report, which showed that inflation remained much higher than the Bank of England target of 2.0%.
In a report, the Office of National Statistics (ONS) showed that the headline Consumer Price Index eased a bit to 3.6% in October, while the core CPI moved to 3.7%.
Another report released on Friday showed that the country’s retail sales declined by 1.1% in October, while consumer sentiment moved lower. Retail sales remain 3% below the pre-pandemic levels. A closely-watched report showed that UK consumer confidence dropped as they braced for more bad news about the economy.
These numbers mean that the Bank of England will likely cut interest rates by 0.25% in the next meeting in December, a move that may push inflation higher.
The most important catalyst for the GBP/USD pair will be the upcoming budget reading by Rachel Reeves, in which she will talk about the budget and her plans to boost growth and fill her multi-billion pound deficit.
The t6 will also react to the upcoming US construction confidence report, which will come out on Thursday. Analysts expect the report to show that consumer confidence moved downwards a bit in November.
GBP/USD Technical Analysis
The GBP/USD exchange rate has remained under pressure in the past few months as the US dollar index continued rising. It has moved below the 38.2% Fibonacci Retracement level.
The pair has moved below the 50-day Exponential Moving Average (EMA). It has also dropped below the important support level at 1.3165, the neckline of the double-top pattern at 1.3715.
The pair has moved below the Ichimoku cloud indicator, while the Relative Strength Index (RSI) and the MACD have moved downwards.
Therefore, the pair will likely continue falling as sellers target the next key support level at 1.2955, the 50% Fibonacci Retracement level. A move above the important resistance level at 1.3200 will point to more gains.
More By This Author:
CoreWeave Stock Analysis: Is This Data Center Company A Buy Or Sell?GBP/USD Signal: Bearish As A Death Cross Pattern Nears
AUD/USD Forex Signal: Stuck In A Range, But A Bearish Breakout Possible
Risk Disclaimer: DailyForex will not be held liable for any loss or damage resulting from reliance on the information contained within this website including market news, analysis, trading signals ...
more


