GBP/USD Forex Signal: Climb To 1.2400 Highly Likely
Bullish View
- Set a buy-stop at 1.2292 and a take-profit at 1.2400.
- Add a stop-loss at 1.2100.
- Timeline: 2 days.
Bearish View
- Set a sell-stop at 1.2163 and a take-profit at 1.2080.
- Add a stop-loss at 1.2250.
The GBP/USD price jumped to the highest level since August 2nd after the latest American inflation data. It rose to a high of 1.2275, which was about 2.2% above the lowest level this month. It has risen by 5.2% from the year-to-date low.
US Dollar Pulls Back
The GBP/USD price continued its recovery in the overnight session as the market reflected on the latest American inflation data. The numbers revealed that consumer prices declined broadly helped by the falling gasoline prices.
Gas prices moved from a high of $5 in June to $4.03 in July as crude oil prices declined. West Texas Intermediate (WTI) has dropped from the year-to-date high of 135 to less than 105 in July. This is notable since gas prices have a strong part in broad inflation.
The headline consumer inflation dropped from 1.3% to 0.0% leading to a year-on-year gain of 8.5%. Inflation moved from the previous high of 9.1%. On the other hand, core inflation, which excludes the volatile food and energy prices, declined from 0.7% to 0.3%.
The US dollar index crashed by more than 1% to $104.2, which was substantially lower than the year-to-date high of $109.30. Similarly, the yield of the 10-year yield dropped to 2.79% while the 5-year dropped to 2.59%.
The next key catalyst for the GBP/USD pair will be the upcoming US producer price index (PPI) data. Economists expect the data to show that the headline PPI dropped from 11.3% to 10.4% in June. On a month-on-month basis, they expect that the PPI dropped from 1.1%.
Core PPI is expected to have dropped from 8.2% to 7.6%. The GBP/USD pair will also react to the upcoming US GDP data scheduled for Friday.
GBP/USD Forecast
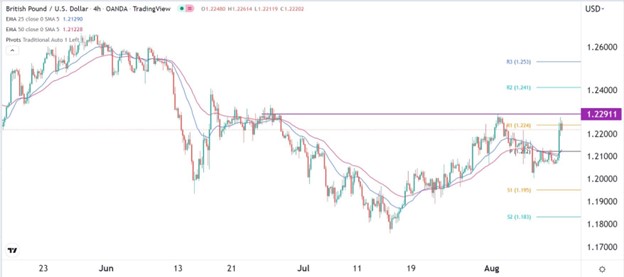
The four-hour chart shows that the GBP/USD price bounced back after the latest US inflation data. It rose to a high of 1.2275, which was the highest level since August 2. On the four-hour chart, the pair rose to the first resistance point of the standard pivot point.
It also rose above the 25-day and 50-day moving averages while the MACD has continued rising. Therefore, the pair will likely keep rising as bulls target the next key resistance level at 1.2400.
(Click on image to enlarge)

More By This Author:
AUD/USD Forex Signal: New Falling Price Channel
Natural Gas Technical Analysis: Correcting Upward Trend
BTC/USD Forex Signal: BTC Forms Ascending Triangle Pattern
Disclosure: DailyForex will not be held liable for any loss or damage resulting from reliance on the information contained within this website including market news, analysis, trading signals ...
more


