GBP/USD Forex Signal - Bullish Outlook Ahead Of US Inflation Data
Bullish view
- Buy the GBP/USD pair and set a take-profit at 1.3700.
- Add a stop-loss at 1.3415.
- Timeline: 1-2 days.
Bearish view
- Sell the GBP/USD pair and set a take-profit at 1.3415.
- Add a stop-loss at 1.3700.
(Click on image to enlarge)
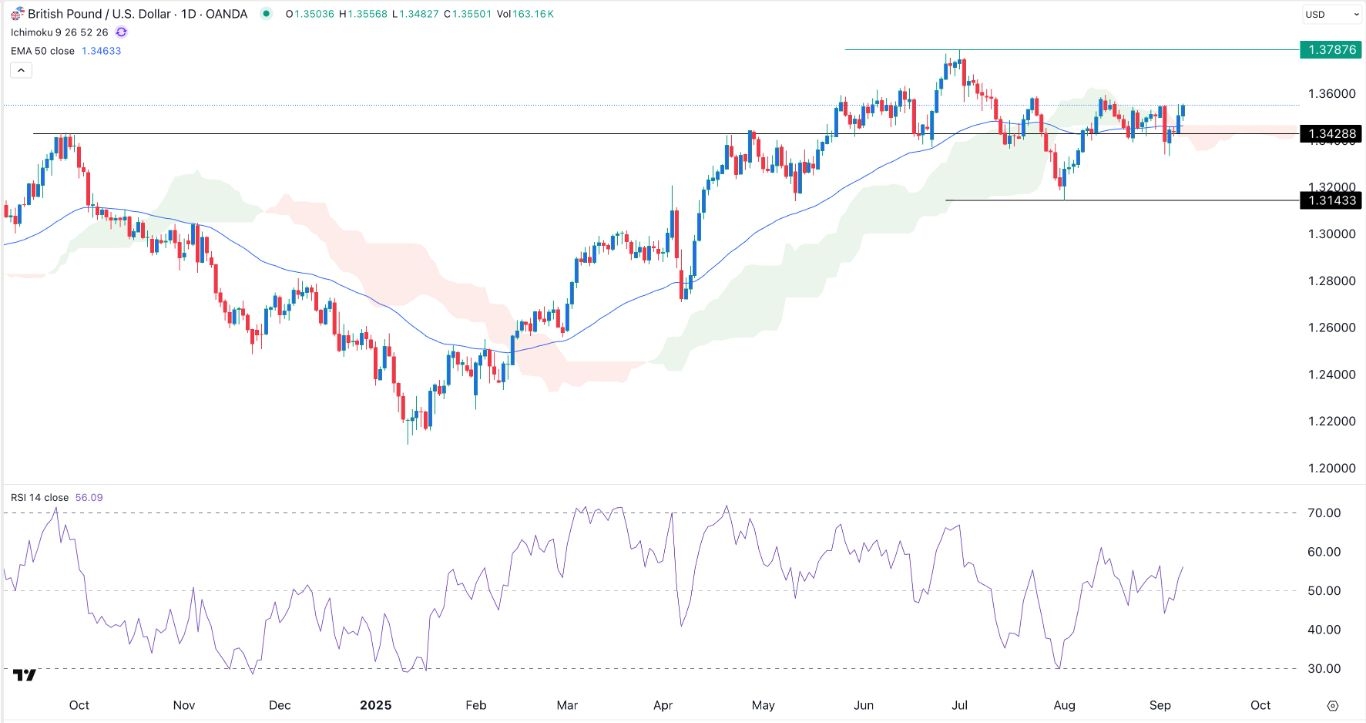
The GBP/USD exchange rate continued rising as the US dollar index (DXY) continued its freefall following the recent US jobs numbers released last week. It was trading at 1.3550, up from last month's low of 1.3143.
US Inflation Data Ahead
The GBP/USD exchange rate continued rising this week as traders waited for the US jobs data, which showed that the economy created just a handful of jobs in August. This report also confirmed that the economy lost jobs in June for the first time since the pandemic.
The next important catalyst for the GBP/USD exchange rate will be the upcoming economic data from the US. The first report will come out later on Tuesday when the Bureau of Labor Statistics will publish the latest annual revision of the jobs numbers.
This report will be followed by the latest Producer Price Index (PPI) data, which will come out on Wednesday. Economists polled by Reuters expect the data to show that the headline PPI rose to 3.3% in August, while the core PPI slowed down to 3.5%.
The other key report will be the latest consumer inflation data on Thursday. Economists see the upcoming numbers confirming that Donald Trump's tariffs continue to have an impact on inflation.
The headline CPI is expected to come in at 2.9%, higher than the previous month's 2.7%, while the core inflation moved to 3.1%.
These numbers will come a week before the Federal Reserve and Bank of England’s interest rate decision. The weak labor market means the Fed will cut interest rates by 0.25% to between 4.0% and 4.25%.
On the other hand, the BoE will likely leave interest rates unchanged as inflation remains significantly higher than the 2% target. The most recent data showed that the headline inflation rose to 3.6% in August.
GBP/USD Technical Analysis
The daily timeframe chart shows that the GBP/USD exchange rate has rebounded in the past few weeks, moving from a low of 1.3143 in July to 1.3552.
It has moved above the important resistance level at 1.3428, the highest swing in September last year.
The pair has moved above the 50-day moving average and the Ichimoku cloud indicator. Also, the Relative Strength Index has moved above the important point at 50.
Therefore, the pair will likely continue rising, with the next target to watch being the year-to-date high of 1.3787. A move below the support at 1.3428 will invalidate the bullish outlook.
More By This Author:
EUR/USD Forex Signal: Set To Hit YTD High Ahead Of Key EventsSynopsys Stock Price Bullish Flag Points To A Surge After Earnings
BTC/USD Forex Signal: Bitcoin Pressured Despite ETF Inflows
Risk Disclaimer: DailyForex will not be held liable for any loss or damage resulting from reliance on the information contained within this website including market news, analysis, trading signals ...
more


