GBP/USD Forex Signal: Break-And-Retest Points To More Downside
Bearish view
- Sell the GBP/USD pair and set a take-profit at 1.3015.
- Add a stop-loss at 1.3255.
- Timeline: 1-2 days.
Bullish view
- Buy the GBP/USD pair and set a take-profit at 1.3255.
- Add a stop-loss at 1.3015.
(Click on image to enlarge)

The GBP/USD exchange rate bounced back, rising for three consecutive days, moving from a low of 1.3016 to a high of 1.3165. It rose as the US Dollar Index (DXY) retreated and as traders waited for key macro numbers.
The GBP/USD exchange rate will react to the upcoming UK jobs numbers on Tuesday. Economists expect the upcoming report to show that the situation worsened in September. The unemployment rate is expected to come in at 4.9% from the previous 4.8%.
Meanwhile, analysts expect the report to show that wages softened from 5% to 4.9%. Also, they see the report showing that the number of people filing for claims rose in October.
These numbers will come a week after the Bank of England (BoE) left interest rates unchanged. Officials warned that inflation was sticky and that more cuts would fuel further price hikes.
The pair also reacted to a statement by Rachel Reeves who hinted that she will hike taxes. She will do that in the upcoming budget reading on November 26.
The next key macro data to watch will be the upcoming UK GDP data on Thursday. Economists expect the report to show that the economy slowed to 1.1% in September.
They also see the report showing that the economy grew by 1.3% in the third quarter. The UK will also publish the latest industrial and manufacturing production data.
The GBP/USD pair will also react to any news on the ongoing US government shutdown that has extended for weeks. It is now having an impact on the economy as food stamps run out and many airlines start cancelling flights.
GBP/USD Technical Analysis
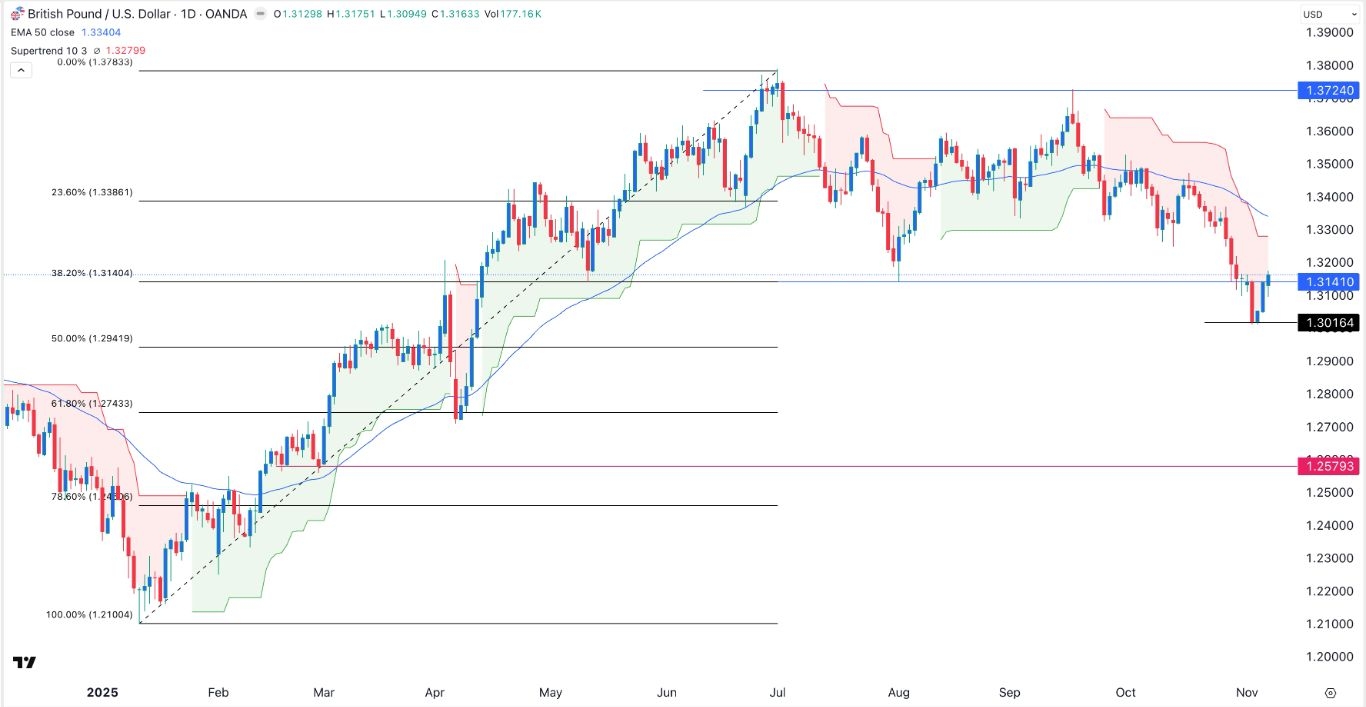
The daily timeframe chart shows that the GBP/USD pair has remained under pressure in the past few months. It formed a double-top at 1.3725 and a neckline at 1.3141. This neckline has coincided with the 38.2% Fibonacci Retracement level. It has also retested that level, confirming a break-and-retest pattern.
The pair has remained below the 50-day Exponential Moving Average (EMA). It has also remained below the Ichimoku cloud and the Supertrend indicators.
Therefore, the pair will likely continue falling as sellers target the next key support at 1.3015. A move below that level will point to more downside, potentially to the 50% retracement at 1.2940.
More By This Author:
Top Catalysts For The S&P 500 Index And VOO ETF This WeekBTC/USD Forex Signal: Bitcoin Remains Under Pressure Despite Rebound
AUD/USD Forex Signal: Bears Prevail Ahead Of ADP Jobs Data
Risk Disclaimer: DailyForex will not be held liable for any loss or damage resulting from reliance on the information contained within this website including market news, analysis, trading signals ...
more


