GBP/USD Forex Signal: Bearish Outlook Ahead Of UK Inflation Data
Bearish view
- Sell the GBP/USD pair and set a take-profit at 1.3015.
- Add a stop-loss at 1.3300.
- Timeline: 1-2 days.
Bullish view
- Buy the GBP/USD pair and set a take-profit at 1.3300.
- Add a stop-loss at 1.3015.
(Click on image to enlarge)

The GBP/USD exchange rate remained stuck at the important support at 1.3200 on Monday, down by 4.45% from its highest point this year. The pair will be in the spotlight as the UK publishes key macro data and as Rachel Reeves’ budget day nears.
UK Inflation Data Ahead
The GBP/USD pair has been under intense pressure after the UK published the jobs and GDP numbers last week. A report by the ONS on Thursday showed that the UK GDP rose slightly in October.
The economy contracted by 0.1% in September, a move that was blamed for the JLR cyber-attack that pushed the company to idle its plant in the UK. It also contracted as exports to the US plunged because of the substantial tariffs.
The next key catalyst for the GBP/USD pair will be the upcoming UK inflation numbers that will come out on Wednesday. Economists polled by Reuters expect the report to show that the headline CPI dropped from 3.8% in September to 3.6% from the previous 3.8%.
Core inflation, which excludes the volatile food and energy prices, is expected to move from 3.5% to 3.4%. The UK’s retail sales are expected to come in at 4.3% from the previous 4.5%.
Forex traders will also be looking forward to clues of next week’s budget reading by Rachel Reeves budget. On Friday, the pair reacted to reports that she would not hike income taxes as previously expected.
Other rumors are that the Chancellor will introduce a new levy on high-value homes. He also plans to end heat pump subsidies. All these measures are aimed at filling the huge gap between the budget and income.
There will be no major macro data from the US on Monday as the government shutdown ended recently. As such, traders will focus on cues on what the Federal Reserve will do in the next meeting.
GBP/USD Technical Analysis
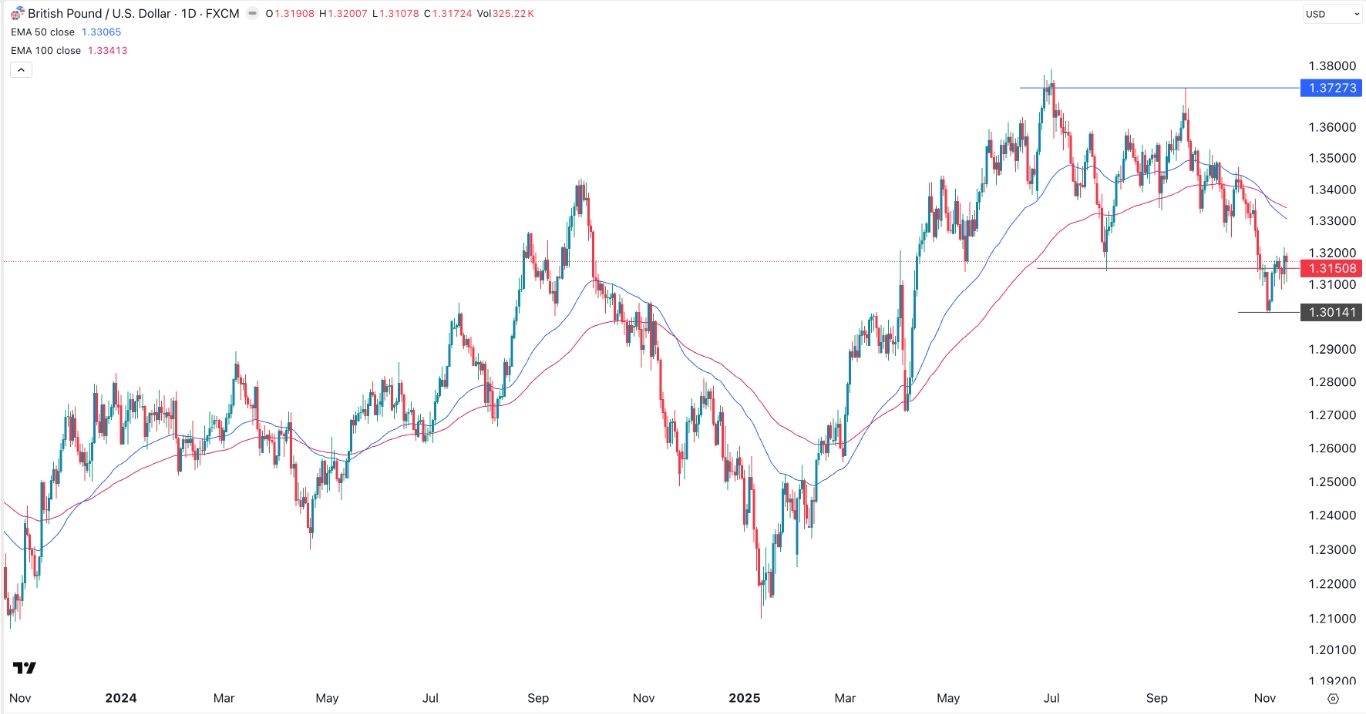
The daily chart shows that the GBP/USD exchange rate has remained on edge in the past few months. It has slumped from the September high of 1.3727 to the current 1.3172.
It formed the risky double-top pattern, a popular risky pattern whose neckline was at 1.3150. It then retested the neckline, confirming the break-and-retest pattern.
The pair has remained below the 50-day and 100-day Exponential Moving Averages (EMA). Therefore, the most likely scenario is where it continues falling, with the next point to watch being at 1.3015, its lowest level this month.
More By This Author:
Ethereum Price Prediction As ETH ETFs Shed $1.2 BillionBTC/USD Forex Signal: Bitcoin Price Is At Risk Of Further Downside
EUR/USD Forex Signal: Bearish Pressure Persists
Risk Disclaimer: DailyForex will not be held liable for any loss or damage resulting from reliance on the information contained within this website including market news, analysis, trading signals ...
more


