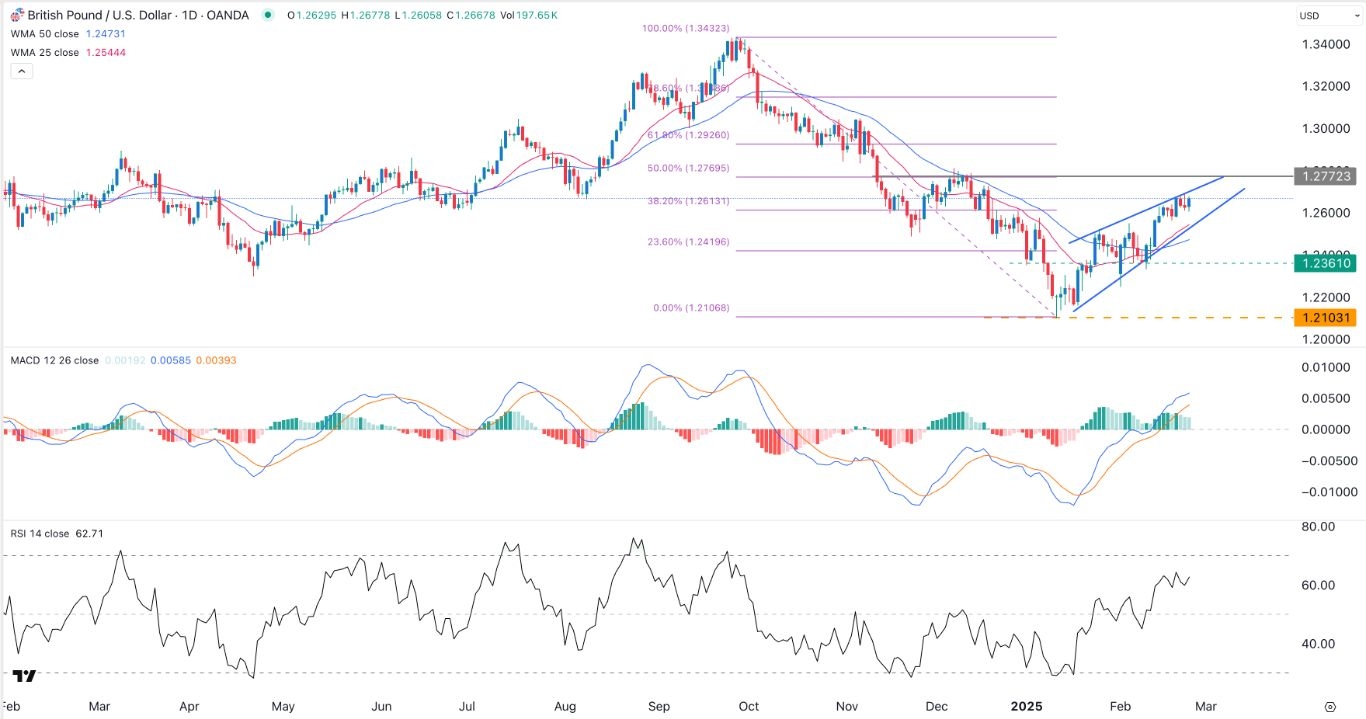
GBP/USD Forex Signal: Bearish Flag Pattern Forms
Bearish View
- Sell the GBP/USD pair and set a take-profit at 1.2200.
- Add a stop-loss at 1.2425.
- Timeline: 1-2 days.
Bullish View
- Buy the GBP/USD pair and set a take-profit at 1.2425.
- Add a stop-loss at 1.2200.
(Click on image to enlarge)

The GBP/USD exchange rate wavered as focus shifted from this week’s swearing in of Donald Trump to next week’s policy statements by the Bank of England (BoE) and the Federal Reserve (Fed). It was trading at 1.2330, up by almost 2% from its lowest level this month.
The GBP/USD pair has moved upwards mostly because of the ongoing US dollar index (DXY) retreat. It has dropped from the year’to-date high of $1110 to below $107.
This price action happened in a week when there was no major economic numbers from the United States and the UK.
As such, focus is on the upcoming Federal Reserve and the Bank of England (BoE) interest rate decisions. There are high chances that the two banks will diverge on interest rates.
Economists expect the BoE to slash interest rates by either 0.25% or 0.50% in a bid to reboot the ailing economy. Odds of these cuts rose after the recent UK inflation data. According to the Office of the National Statistics (ONS) showed that the headline Consumer Price Index (CPI) dropped from 2.6% in November to 2.5%. Core inflation dropped from 3.5% to 3.2%.
Another report showed that the headline retail sales dropped from 0.1% to minus 0.3%, while the core CPI moved from 0.1% to minus 0.6%. Therefore, after embracing a moderately cautious tone, there are odds that the BoE will deliver multiple cuts this year.
The Federal Reserve, on the other hand, will maintain higher interest rates for a while since inflation remains high. The headline consumer inflation rose from 2.7% to 2.9%, while core inflation moved from 3.3% to 3.2%.
GBP/USD technical analysis
The GBP/USD exchange rate has risen from a low of 1.2100 on January 13 to a high of 1.2355. On the four-hour chart, the pair has formed an ascending channel. This channel formed after it dropped sharply, meaning that it has formed a bearish flag chart pattern. It has also moved below the key support at 1.2352, its lowest swing on January 2.
The Average Directional Index (ADX) has moved downwards, a sign that the uptrend has faded. Therefore, the pair will likely continue falling as sellers target the lower side of the channel at 1.2225.
More By This Author:
BTC/USD Forex Signal: Steady As Strategic BTC Reserves Odd RiseBTC/USD Forex Signal: Double-Top Chart Pattern Forms
EUR/USD Forex Signal: Rebounds As Trump Takes Charge
Disclosure: DailyForex will not be held liable for any loss or damage resulting from reliance on the information contained within this website including market news, analysis, trading signals ...
more


