
GBP/USD Forecast: Sellers Aiming For 1.3000 As BoE-Fed Divergence Plays
- The GBP/USD forecast shows the pair stabilized under 1.1350 amid the diverging policy decisions by the Fed and BoE.
- The UK inflation data, fiscal concerns, and softer retail sales data weigh the pound.
- Traders await commentary from FOMC Members Hammock, Logan, and Bostic for further policy cues.
The GBP/USD forecast shows a steady movement, trading near 1.1350 on Friday as investors assess the diverging decisions of the Federal Reserve and the Bank of England. According to the CME FedWatch Tool, the pair was backed by a soft US dollar as markets priced in a 71% probability of a December cut.
However, the Fed Chair Powell noted that a December cut seems vague due to limited data amid the persistent US government shutdown. This development lifted the US dollar. Meanwhile, this Wednesday, the Fed’s 25 bps decision reflected a divided decision among policymakers.
From the UK, the pound remained under continued pressure as the UK CPI came in softer than expected and fiscal uncertainty gained traction ahead of the November 26 budget, intensifying expectations for Fed easing by the BoE. The Office for Budget Responsibility (OBR) data revealed a 0.3% decline in productivity growth. This data indicates a potential £20 billion fiscal gap.
Additionally, Chancellor Rachel Reeves hinted at potential tax increases or borrowing adjustments, affecting investor confidence. Meanwhile, the British Retail Consortium revealed weak food prices, favoring further policy easing.
GBP/USD Daily Key Events
The significant events in the day include
- US Chicago PMI
- FOMC member Hammock speaks
- FOMC member Logan speaks
- FOMC member Bostic speaks
On Friday, traders look ahead to the speeches by FOMC members Hammock, Logan, and Bostic for insights into the inflation trends and Fed policy direction.
GBP/USD Technical Forecast: Struggling to Hold Above Key MAs
(Click on image to enlarge)
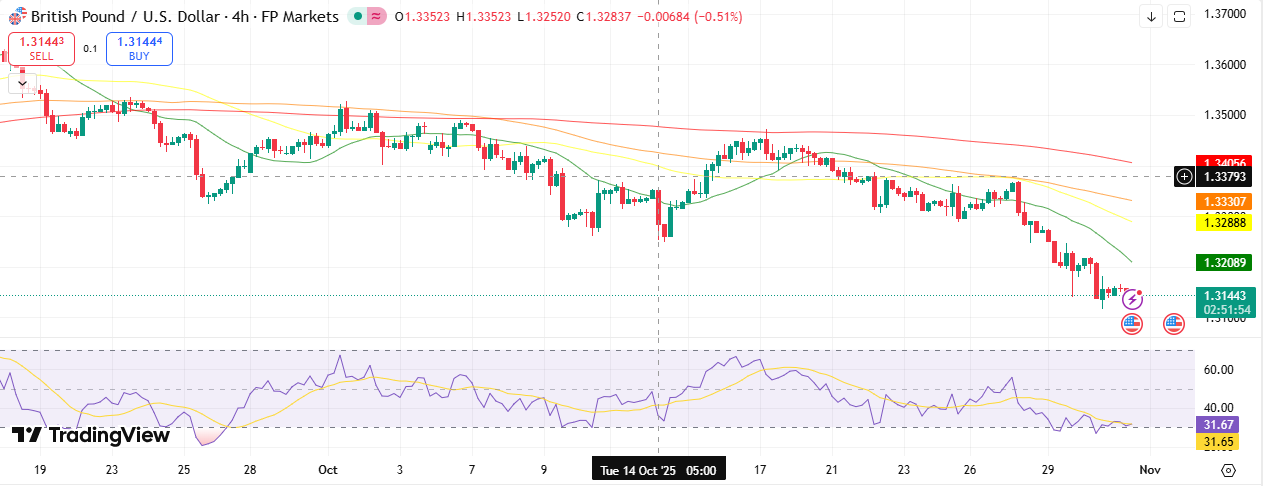
GBP/USD 4-hour chart
The GBP/USD 4-hour chart reflects a persistent bearish trend. The price stays below the key moving averages. The 20-period MA above 1.3200 keeps the selling bias intact. The bears will sustain the pressure unless the price closes above this level. The RSI is near 30.0, signaling sellers’ dominance and oversold conditions. However, there are no signs of a trend reversal.
A decisive break above the 1.3200 level could trigger short-term stabilization. Conversely, a sustained drop below the 1.3140 level could extend the downside towards 1.3080.
Support Levels
- 1.3140
- 1.3080
- 1.3000
Resistance Levels
- 1.3200
- 1.3280
- 1.3330
More By This Author:
EUR/USD Outlook: Bears Sustain Amid Steady ECB, Fed’s CautiousnessGBP/USD Forecast: Slides Lower Amid Cautious Fed, Mixed Market Sentiment
AUD/USD Outlook: Gains Limited Amid Less Dovish Fed
Disclaimer: Foreign exchange (Forex) trading carries a high level of risk and may not be suitable for all investors. The risk grows as the leverage is higher. Investment objectives, risk ...
more

