Monday, January 5, 2026 6:46 AM EST

Photo by Colin Watts on Unsplash
In 2025, GBP/USD rose from 1.21, a 15-month low, to a four-year high of 1.3790 by July 1, before consolidating across the summer. The pair fell between September and November before bouncing back in the final weeks of the year. However, with questions over how much lower the USD could go, GBP/USD may struggle to book another strong year in 2026. For more insight into the fundamental factors set to drive GBP/USD in 2026, see the fundamental outlook.
GBP/USD technical analysis
(Click on image to enlarge)
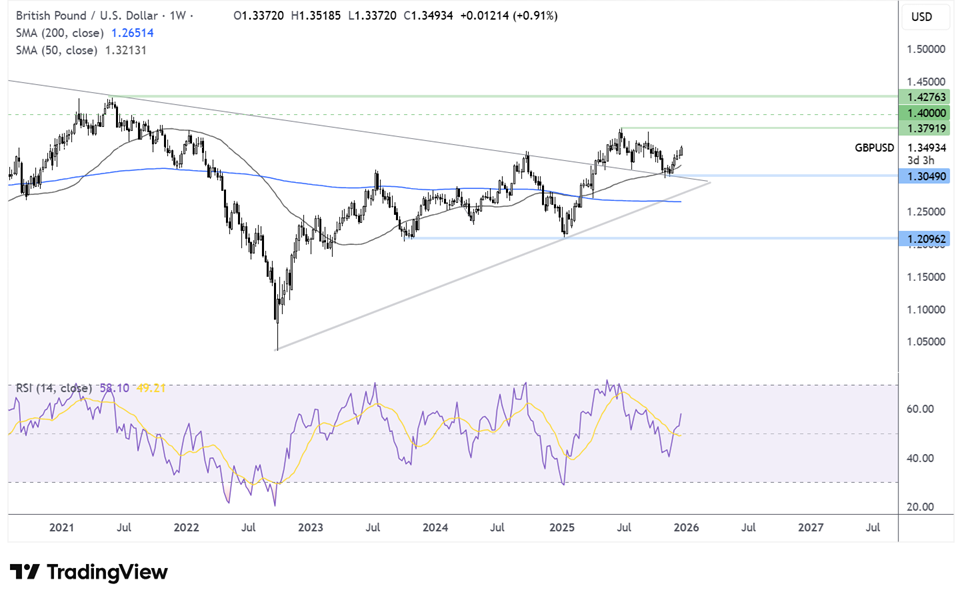
GBP/USD broke out of the symmetrical triangle pattern, rising to a multi-year high of 1.3790, before easing back and testing the trendline support at 1.30 and recovering higher.
The price trades above the 50- and 200-day SMA, which, together with the RSI above 50, suggests a continuation of the recovery towards 1.3790.
A rise above 1.3790 creates a higher high, bringing 1.40 the psychological level and 1.4250, the 2021 high, into focus.
Sellers would need to break below 1.30 to create a lower low and bring 1.2780, the rising trendline support, into focus. A break below here exposes the 200 SMA at 1.2650 ahead of the 1.21 January low.
More By This Author:
Two Trades To Watch: GBP/USD, Oil Forecast - Wednesday, Dec. 17Two Trades To Watch: EUR/USD, Oil Forecast - Wednesday, Dec. 10Two Trades To Watch: USD/JPY, DAX Forecast - Tuesday, Dec. 9
Disclaimer: StoneX Financial Ltd (trading as “City Index”) is an execution-only service provider. This material, whether or not it states any opinions, is for general information ...
more
Disclaimer: StoneX Financial Ltd (trading as “City Index”) is an execution-only service provider. This material, whether or not it states any opinions, is for general information purposes only and it does not take into account your personal circumstances or objectives. This material has been prepared using the thoughts and opinions of the author and these may change. However, City Index does not plan to provide further updates to any material once published and it is not under any obligation to keep this material up to date. This material is short term in nature and may only relate to facts and circumstances existing at a specific time or day. Nothing in this material is (or should be considered to be) financial, investment, legal, tax or other advice and no reliance should be placed on it.
No opinion given in this material constitutes a recommendation by City Index or the author that any particular investment, security, transaction or investment strategy is suitable for any specific person. The material has not been prepared in accordance with legal requirements designed to promote the independence of investment research. Although City Index is not specifically prevented from dealing before providing this material, City Index does not seek to take advantage of the material prior to its dissemination. This material is not intended for distribution to, or use by, any person in any country or jurisdiction where such distribution or use would be contrary to local law or regulation.
For further details see our full non-independent research disclaimer and quarterly summary.
less
How did you like this article? Let us know so we can better customize your reading experience.


