
- GBP/JPY may find immediate resistance around the 21-day EMA at 191.63.
- The daily chart analysis indicates a potential for a weakening bullish bias.
- A breach below the ascending channel could signal the emergence of a bearish bias.
GBP/JPY retraces its recent gains from the previous two days, trading around 190.90 during the Asian session on Friday. The daily chart analysis indicates that the pair is attempting to break below the lower boundary of the ascending channel, suggesting a potential for a weakening bullish bias. Additionally, the 14-day Relative Strength Index (RSI) is positioned below the 50 level, indicating that bearish momentum is in play.
The MACD (Moving Average Convergence Divergence) line is above the signal line, suggesting that there is some upward momentum in the short term. However, the MACD line is still below the zero line, signaling the overall trend is still bearish. This could indicate a potential recovery or a temporary upward movement within a broader downtrend.
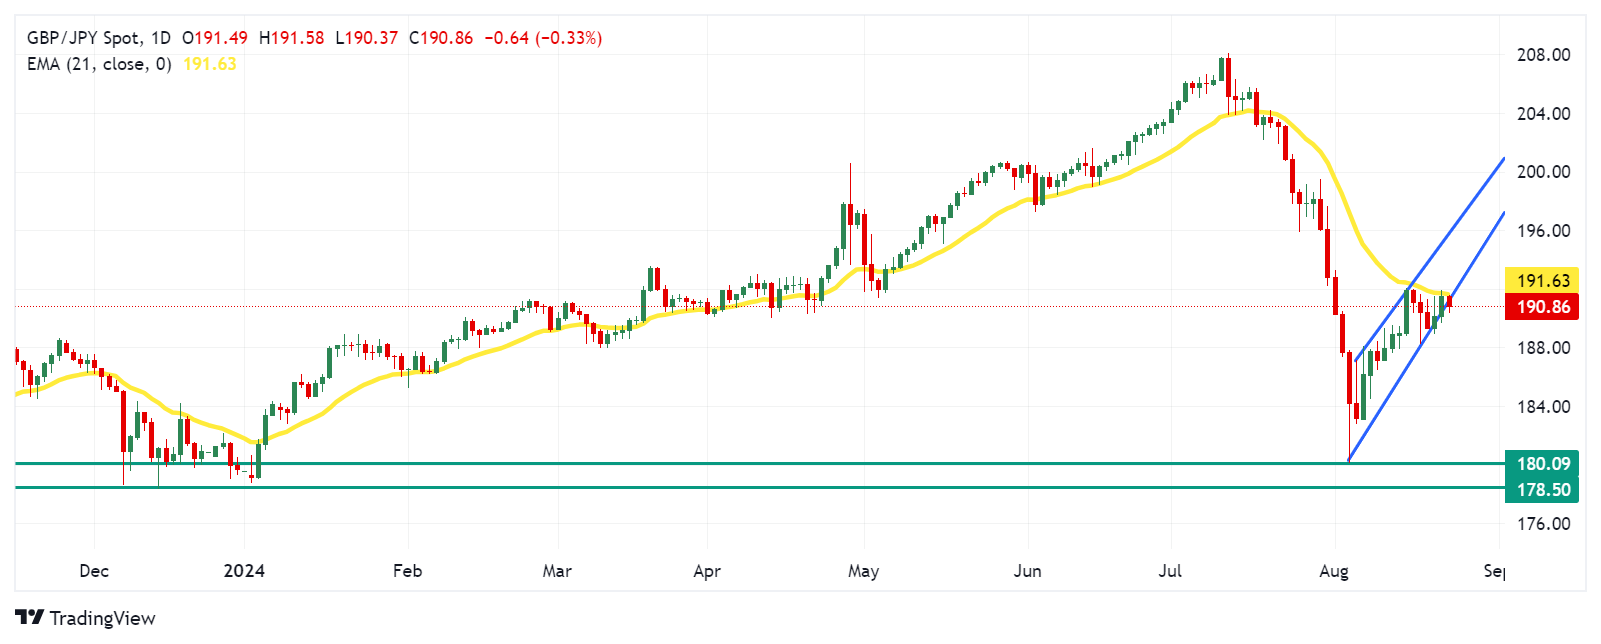
In terms of resistance, the 21-day Exponential Moving Average (EMA) at 191.63 level appears as the immediate barrier. A break above the 21-day EMA could reinforce the bullish sentiment and support the pair GBP/JPY cross to explore the region around the upper boundary of the ascending channel at the 195.50 level.
On the downside, a successful breach below the ascending channel may cause the emergence of the bearish bias and put downward pressure on the GBP/JPY cross to navigate the area around the seven-month low at 180.09 level, which was recorded on August 5. Further support appears at throwback support at 178.50 level.
GBP/JPY: Daily Chart
(Click on image to enlarge)
British Pound PRICE Today
The table below shows the percentage change of British Pound (GBP) against listed major currencies today. British Pound was the weakest against the Japanese Yen.
| USD | EUR | GBP | JPY | CAD | AUD | NZD | CHF | |
|---|---|---|---|---|---|---|---|---|
| USD | -0.15% | -0.25% | -0.64% | -0.19% | -0.34% | -0.57% | 0.07% | |
| EUR | 0.15% | -0.10% | -0.47% | -0.05% | -0.20% | -0.20% | 0.21% | |
| GBP | 0.25% | 0.10% | -0.40% | 0.04% | -0.10% | -0.08% | 0.07% | |
| JPY | 0.64% | 0.47% | 0.40% | 0.42% | 0.28% | 0.27% | 0.46% | |
| CAD | 0.19% | 0.05% | -0.04% | -0.42% | -0.15% | -0.13% | 0.03% | |
| AUD | 0.34% | 0.20% | 0.10% | -0.28% | 0.15% | 0.02% | 0.17% | |
| NZD | 0.57% | 0.20% | 0.08% | -0.27% | 0.13% | -0.02% | 0.15% | |
| CHF | -0.07% | -0.21% | -0.07% | -0.46% | -0.03% | -0.17% | -0.15% |
The heat map shows percentage changes of major currencies against each other. The base currency is picked from the left column, while the quote currency is picked from the top row. For example, if you pick the British Pound from the left column and move along the horizontal line to the US Dollar, the percentage change displayed in the box will represent GBP (base)/USD (quote).
More By This Author:
Silver Price Forecast: XAG/USD Rises Above $29.00 Due To Dovish Mood Surrounding The FedSilver Price Forecast: XAG/USD Hovers Near $29.50 Due To Caution Ahead Of Fed Minutes
USD/CAD Falls Toward 1.3600 Ahead Of FOMC Minutes


Comments
Log in or sign up to join the conversation.