
- GBP/JPY extends decline near 202.20 in Tuesday’s early European session, down 0.45% on the day.
- The cross keeps the negative stance on the 4-hour chart, with the bearish RSI indicator.
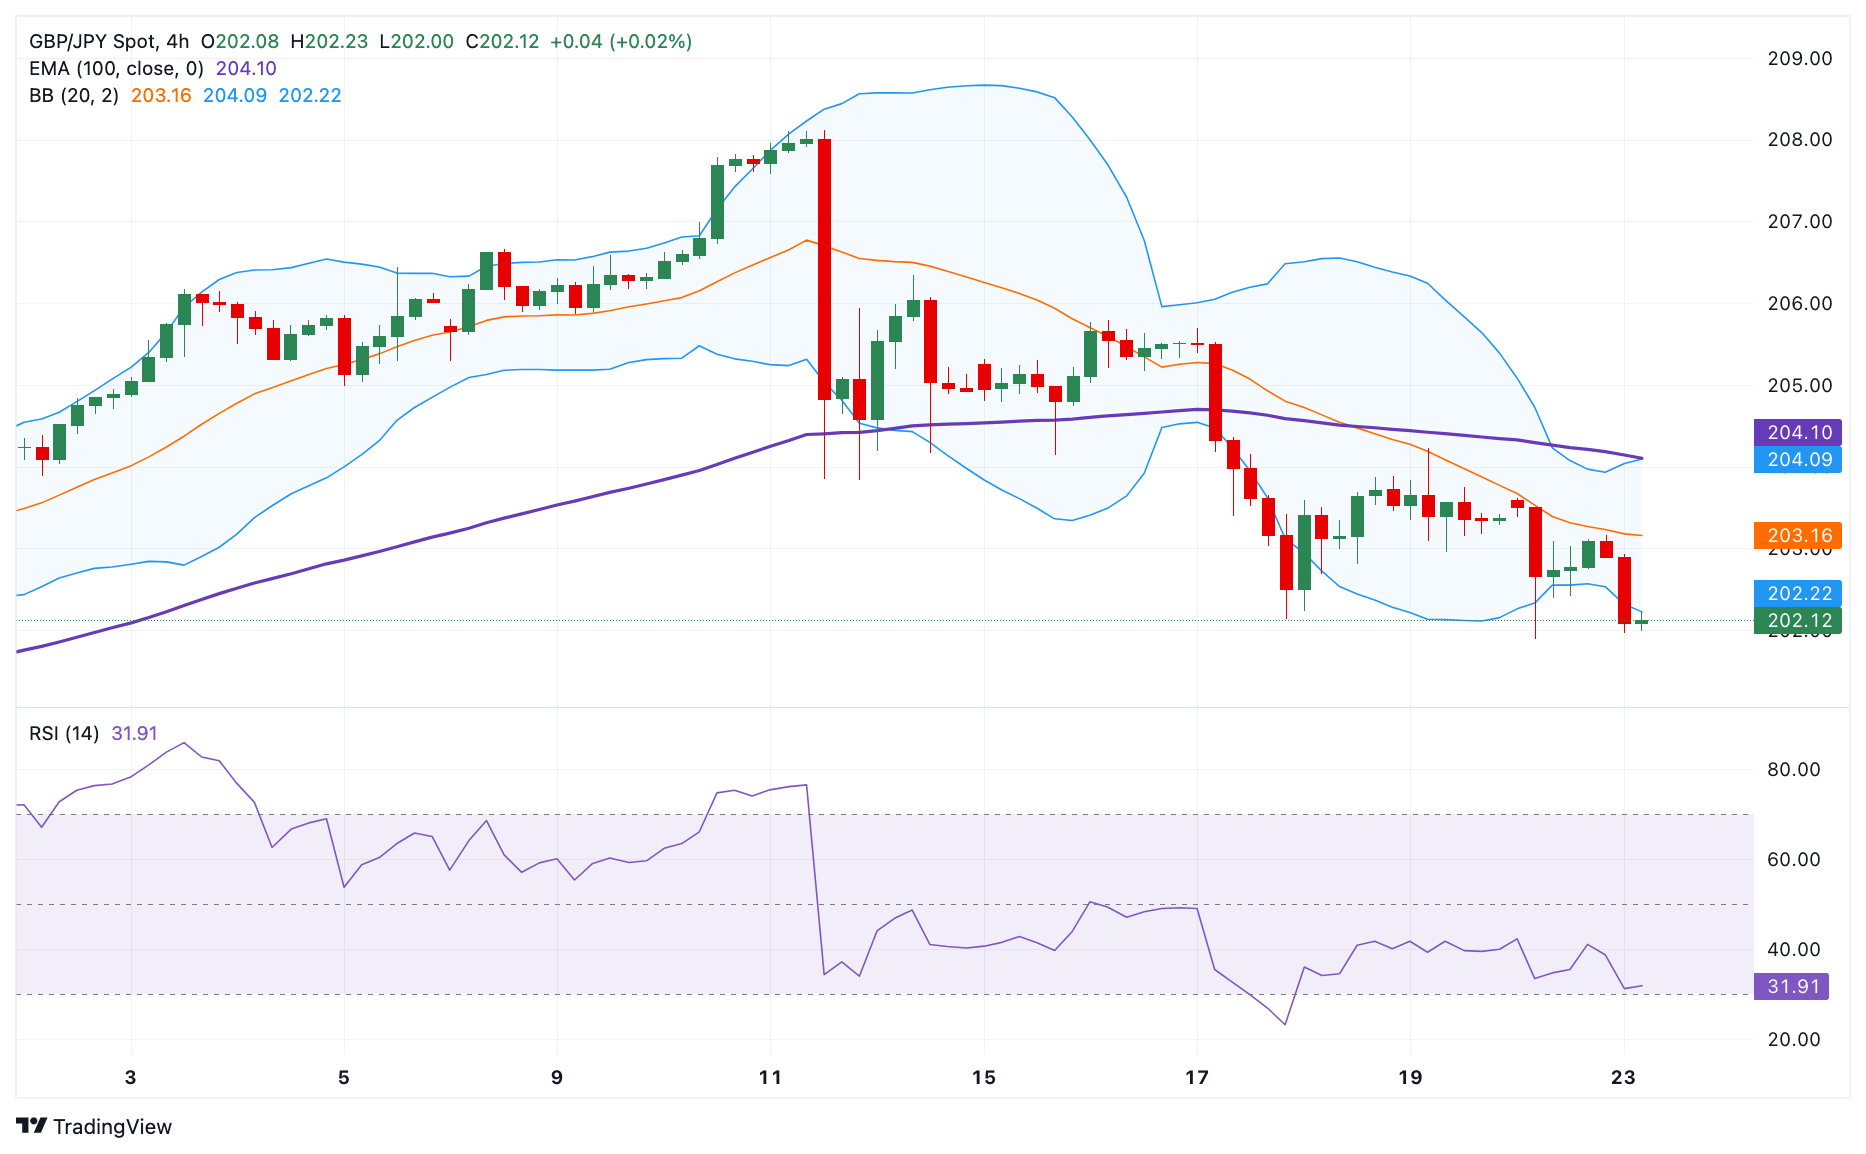
- The key support level emerges at the 202.00 psychological mark; the upside barrier is seen at 203.16.
The GBP/JPY cross remains under some selling pressure around 202.20 on Tuesday during the early European session. The risk-averse environment and growing speculation that the Bank of Japan (BoJ) will hike next week support the Japanese Yen (JPY) and create a headwind for GBP/JPY.
Technically, GBP/JPY maintains the bearish outlook unchanged on the 4-hour chart as it holds above the key 100-period Exponential Moving Average (EMA). Additionally, the Relative Strength Index (RSI) stands in bearish territory below the 50-midline, suggesting extended losses cannot be ruled out.
The key support level will emerge at the 202.00 psychological mark. A decisive break below this level will pave the way to 201.14, a low of June 24. Further south, the next contention level is located at 200.48, a low of June 21.
On the upside, the immediate resistance level for the cross is seen at 203.16, a high of July 22. The crucial upside barrier to watch is the 204.00-204.10 region, representing the conference of the psychological level, 100-period EMA, and the upper boundary of the Bollinger Band.
GBP/JPY 4-hour chart
(Click on image to enlarge)
More By This Author:
WTI Holds Below $79.50 Amid Demand ConcernsEUR/JPY Attracts Some Sellers Below 170.50 Amid BoJ Rate Hike Hopes
EUR/GBP Loses Momentum Below 0.8400 As Traders Trim BoE Rate Cut Bets After UK CPI Data


Comments
Log in or sign up to join the conversation.