GBP/JPY Forms The Top Within Wedge Pattern

Today we want to update the GBP/JPY chart from October 25th.
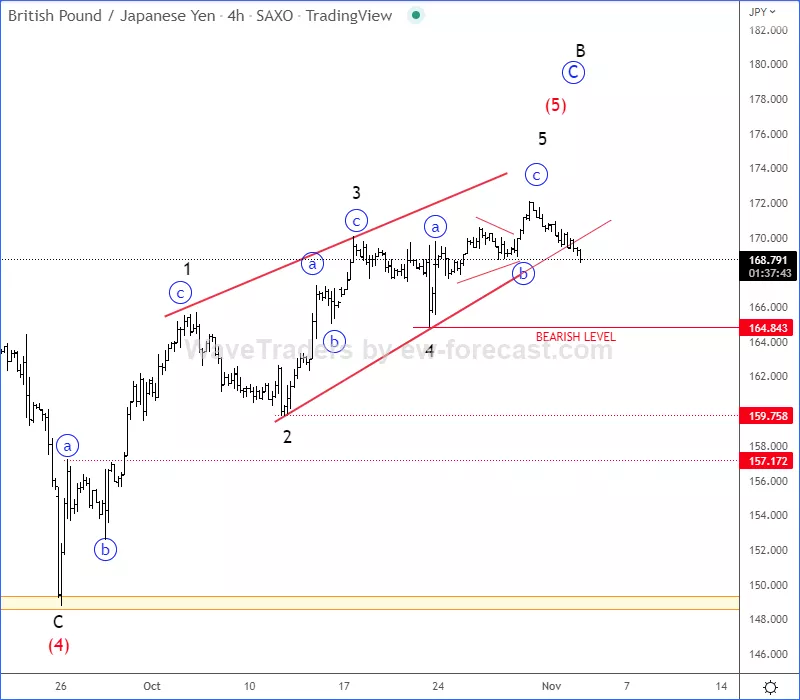
GBP/JPY was bullish for the last two years, but after reaching strong 170 resistance area within final wave (5) of C of B, seems like it's forming the top within the wedge pattern.
Looking at the 4-hour, specifically this final 5th wave of C of B, we can clearly see a bullish price action, but the wave structure is getting overlapped, which means that bulls are running out of steam, ideally within an ending diagonal formation a.k.a. wedge pattern.
(Click on image to enlarge)

As you can see, the GBP/JPY pair is already breaking the lower wedge line and seems like it's forming the top. However, to confirm bears back in the game, we need to see sharp or impulsive drop back beneath 164.84 level.
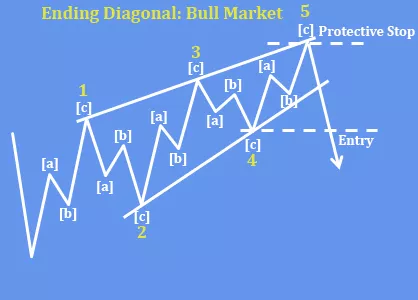
The ending diagonal (wedge) pattern is a special type of wave that occurs in wave 5 of an impulse. An ending diagonal pattern is a type of pattern that can occur at the completion of a strong move. It reflects a “calming” of the market sentiment such that price still moves generally in the direction of the larger move, but not strongly enough to produce an impulsive wave. Ending diagonals consist of five waves, labeled 1-2-3-4-5, where each wave subdivides into three legs. Waves 1 and 4 overlap in price, while wave 3 can not be the shortest amongst waves 1, 3 and 5.
The reason why they are so interesting is because they are indicating a reversal, usually a strong one.

More By This Author:
Ethereum Classic Can Be Finishing A Corrective Pullback
GBPJPY Is Looking For Resistance Around 170 Area
USD/MXN Is Ready For A Bearish Resumption
Disclosure: Please be informed that information we provide is NOT a trading recommendation or investment advice. All of our work is for educational purposes only. Visit www.wavetraders.com for more ...
more


