
- GBP/JPY bull run takes the pair into its highest bids since 2015.
- Technical ceiling parked near 196.00 at June 2015 high.
- Japan National CPI due early Tuesday, is expected to ease further.
GBP/JPY is up over 6% YTD in 2024 as the pair continues to climb into multi-year highs, and has reached its highest bids since August of 2015 just above the 191.00 handle.
This week sees a smattering of UK economic data on the calendar, but is strictly low-tier. Japan’s National Consumer Price Index (CPI) inflation figures are due early Tuesday, with Japanese Retail Trade numbers slated for Thursday.
Japan’s National CPI for the year ended in January is broadly expected to reiterate the findings from the Tokyo CPI advance print as Japanese inflation continues to cool. Core National CPI is forecast to recede to 1.8% YoY from the previous period’s 2.3%.
Early Thursday’s Japan Retail Trade is expected to rebound to 2.3% YoY compared to the previous 2.1%, but January’s Industrial Production is expected to decline sharply by 7.4% compared to the previous month’s 1.4% increase.
GBP/JPY is on fast approach to 2015’s peak bids near 196.00, with prices above the 200.00 major price level waiting beyond. GBP/JPY has not traded above 200.00 since 2008.
GBP/JPY technical outlook
GBP/JPY is up over 3% from February’s bottom bids at 185.23, and the pair is drifting into multi-year peaks that leave the Guppy with few technical barriers as the march up the charts continues.
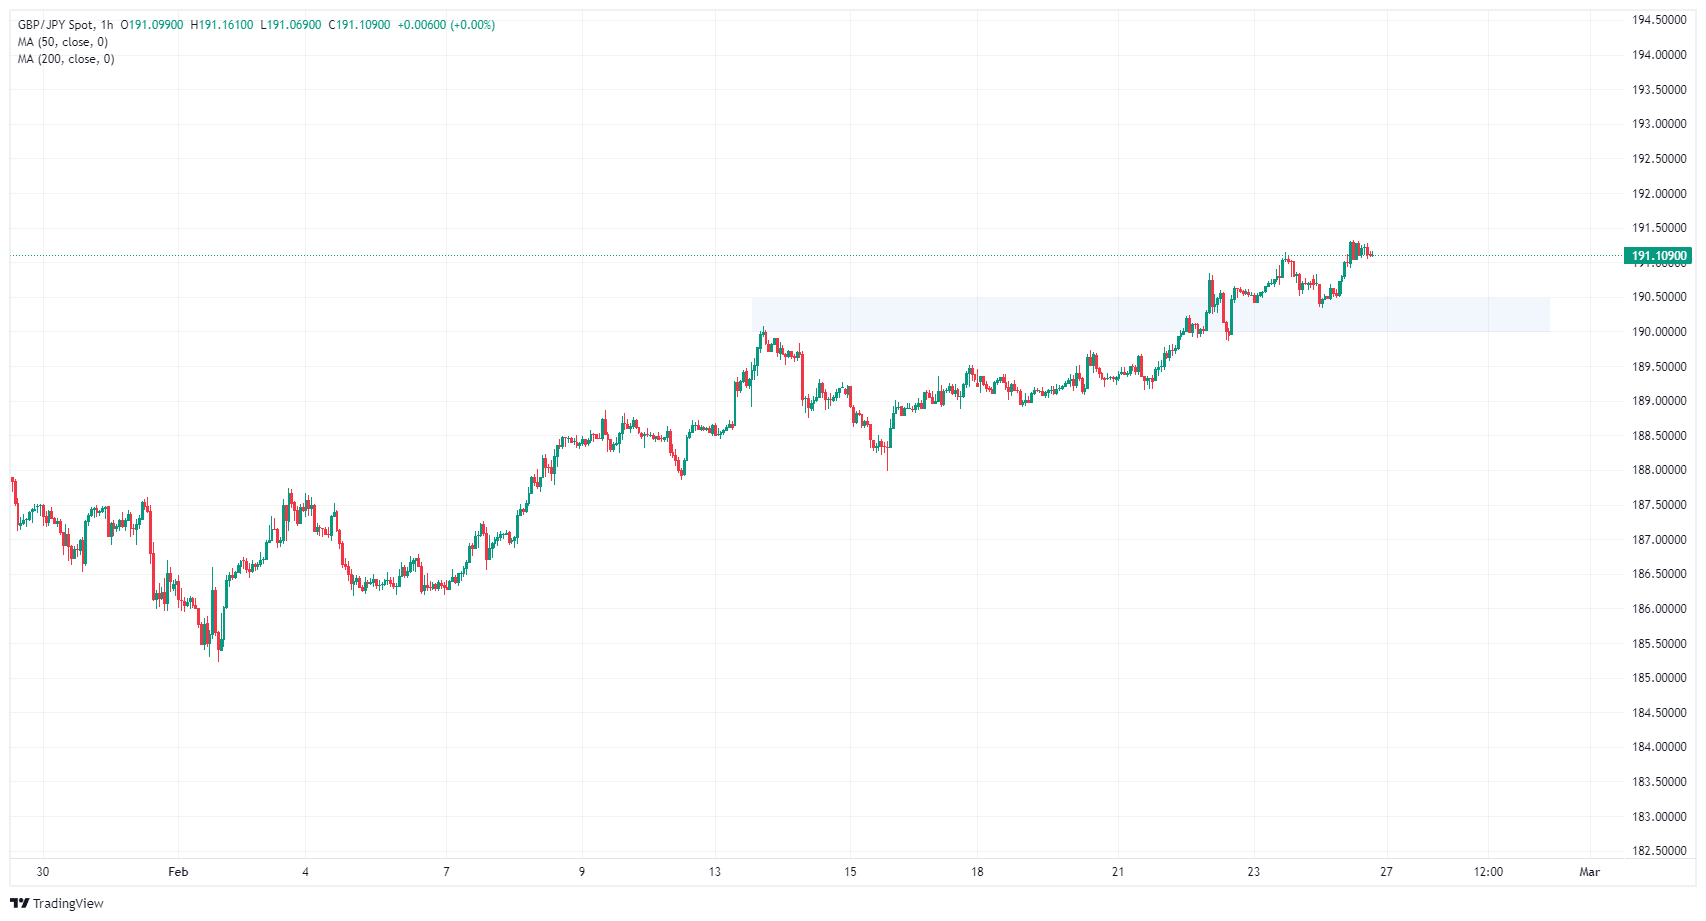
A near-term supply zone is marked out between 190.50 and the 190.00 handle, and 190.00 remains a key technical barrier after previously capping intraday chart action following February’s earlier rejection from the key level.
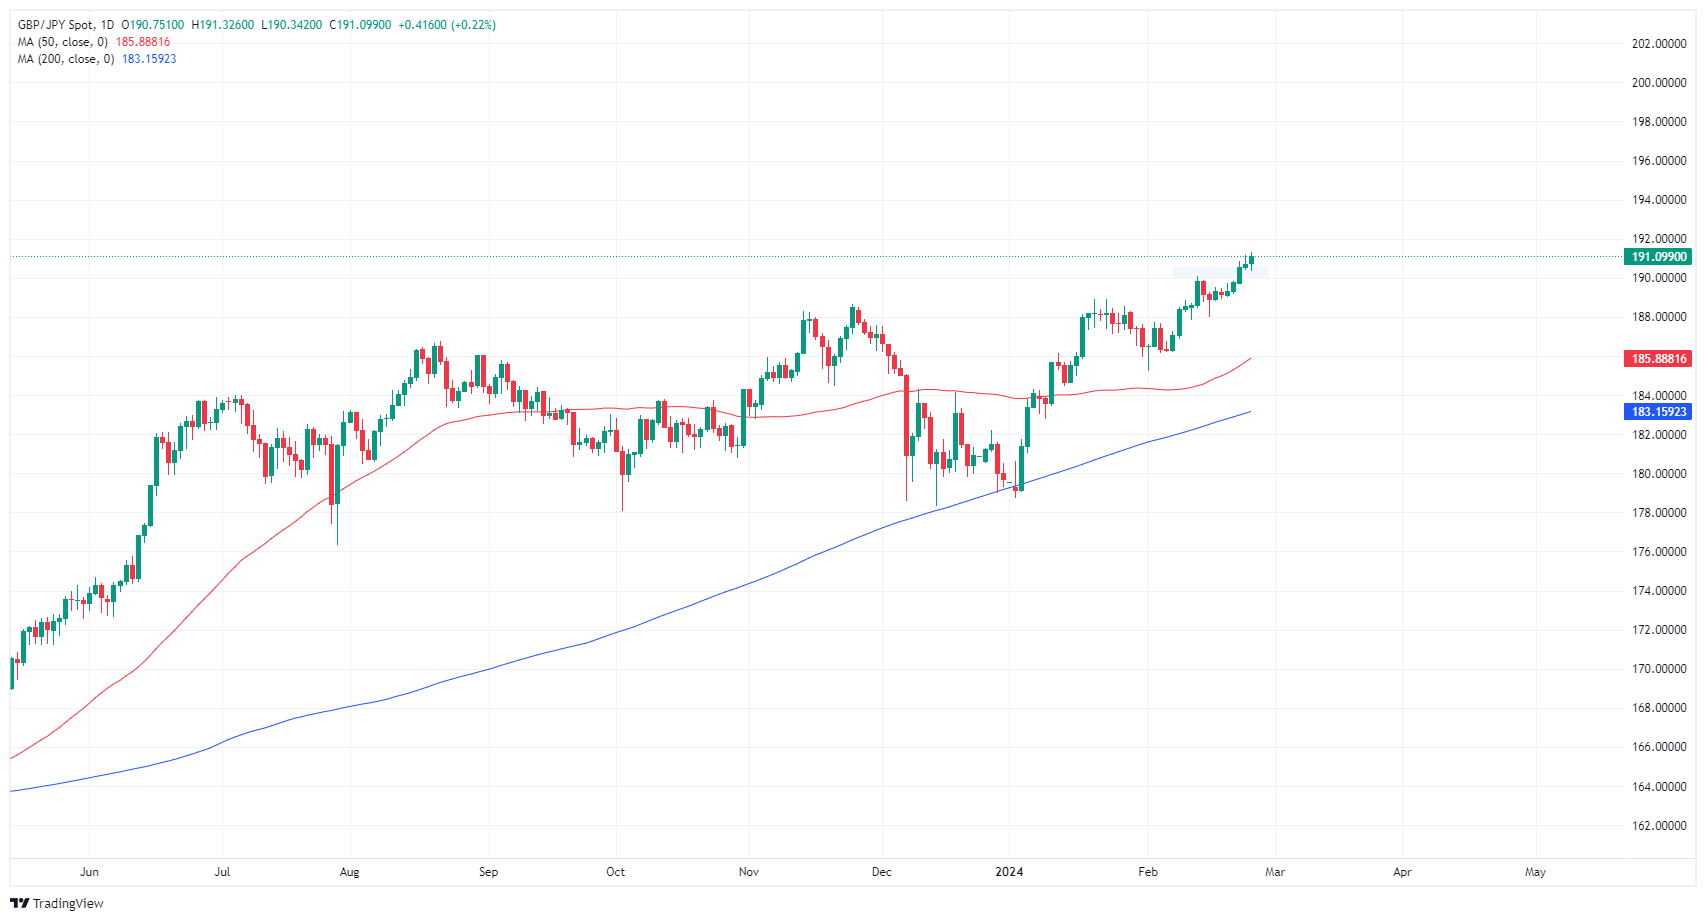
GBP/JPY has surged in 2024, climbing from January’s early bottom at 178.74, catching a bullish rebound from the 200-day Simple Moving Average (SMA) in the process, which is currently rising through the 183.00 handle.
GBP/JPY hourly chart
(Click on image to enlarge)
GBP/JPY daily chart
(Click on image to enlarge)
GBP/JPY
| OVERVIEW | |
|---|---|
| Today last price | 191.16 |
| Today Daily Change | 0.48 |
| Today Daily Change % | 0.25 |
| Today daily open | 190.68 |
| TRENDS | |
|---|---|
| Daily SMA20 | 188.36 |
| Daily SMA50 | 185.68 |
| Daily SMA100 | 184.96 |
| Daily SMA200 | 183.07 |
| LEVELS | |
|---|---|
| Previous Daily High | 191.15 |
| Previous Daily Low | 190.4 |
| Previous Weekly High | 191.15 |
| Previous Weekly Low | 188.91 |
| Previous Monthly High | 188.94 |
| Previous Monthly Low | 178.74 |
| Daily Fibonacci 38.2% | 190.86 |
| Daily Fibonacci 61.8% | 190.69 |
| Daily Pivot Point S1 | 190.34 |
| Daily Pivot Point S2 | 190 |
| Daily Pivot Point S3 | 189.6 |
| Daily Pivot Point R1 | 191.09 |
| Daily Pivot Point R2 | 191.49 |
| Daily Pivot Point R3 | 191.83 |
More By This Author:
US Dollar Trades Lower Following Soft Housing DataUSD/CAD Price Analysis: Improves To Near 1.3520 Following February’s High
EUR/USD Spun Tires Just North Of 1.0800 As Friday's Wrap-Up Went Nowhere


Comments
Log in or sign up to join the conversation.