

Image Source: Pixabay
- GBP/JPY breached 200.60, setting a fresh 34-year high.
- Thin UK data leaves GBP free to drift higher against the Yen.
- Japanese Tokyo CPI inflation due on Friday.
GBP/JPY drifted into a new 34-year high above 200.60 on Tuesday as Yen pairs continue to pare away JPY strength following suspected “Yenterventions” from the Bank of Japan (BoJ) and Japanese Ministry of Finance who overspent nine trillion Yen on miscellaneous financial operations and is broadly assumed to have intervened directly in global markets in an attempt to shore up the battered Yen.
No official statement from the BoJ or the Ministry has been forthcoming, but markets are challenging Japanese planners and shorting the Yen back into multi-decade lows. The Guppy hit its highest bids in 34 years as the wide rate differential between the BoJ and other central banks including the Bank of England (BoE) remains simply too high for markets to bolster the JPY.
The key datapoint for the GBP/JPY this week will be Japan’s Tokyo Consumer Price Index (CPI) inflation update due on Thursday. Core Tokyo CPI for the year ended in May is expected to tick higher to 1.9% from 1.6%. Headline Tokyo CPI inflation last printed at 1.8% in April.
Markets remain unsure of when the BoE will deliver much-hoped for rate cuts. Previous hopes for a June rate cut have evaporated, and investors are looking for signs that the BoE will make a first-rate trim in September.
GBP/JPY technical outlook
The Guppy has traded entirely one-sided since drooping to a near-term low near 191.50. The pair has 4.8% since the beginning of May, and is poised for further gains into multi-decade highs.
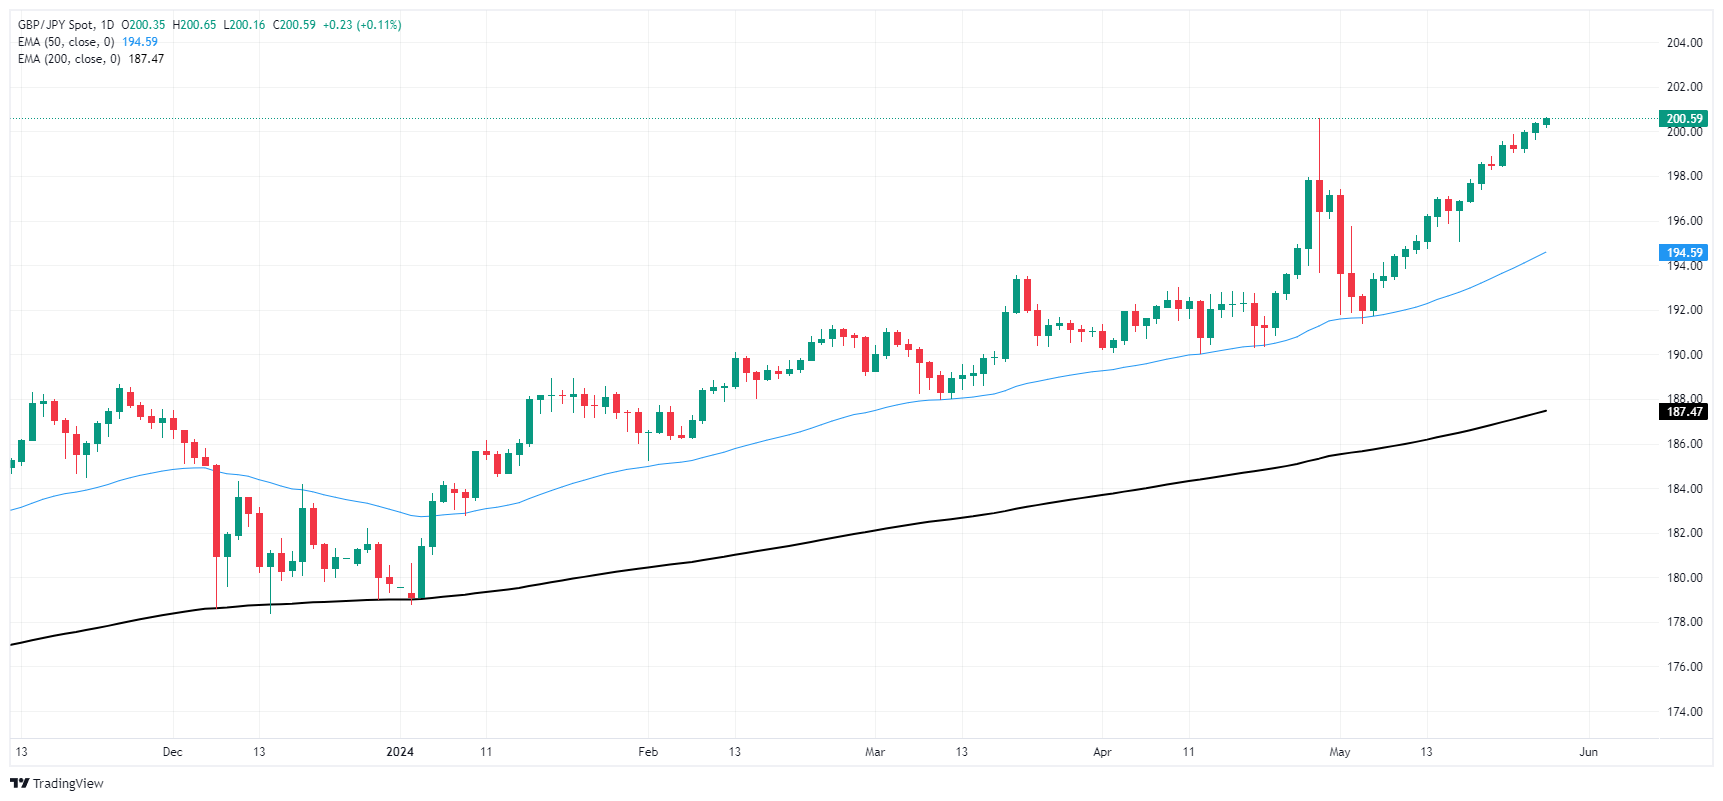
GBP/JPY is up over 12% after knocking into the 200-day Exponential Moving Average (EMA) at the beginning of 2024. The pair has closed in the green for all but three of the last 16 consecutive trading days.
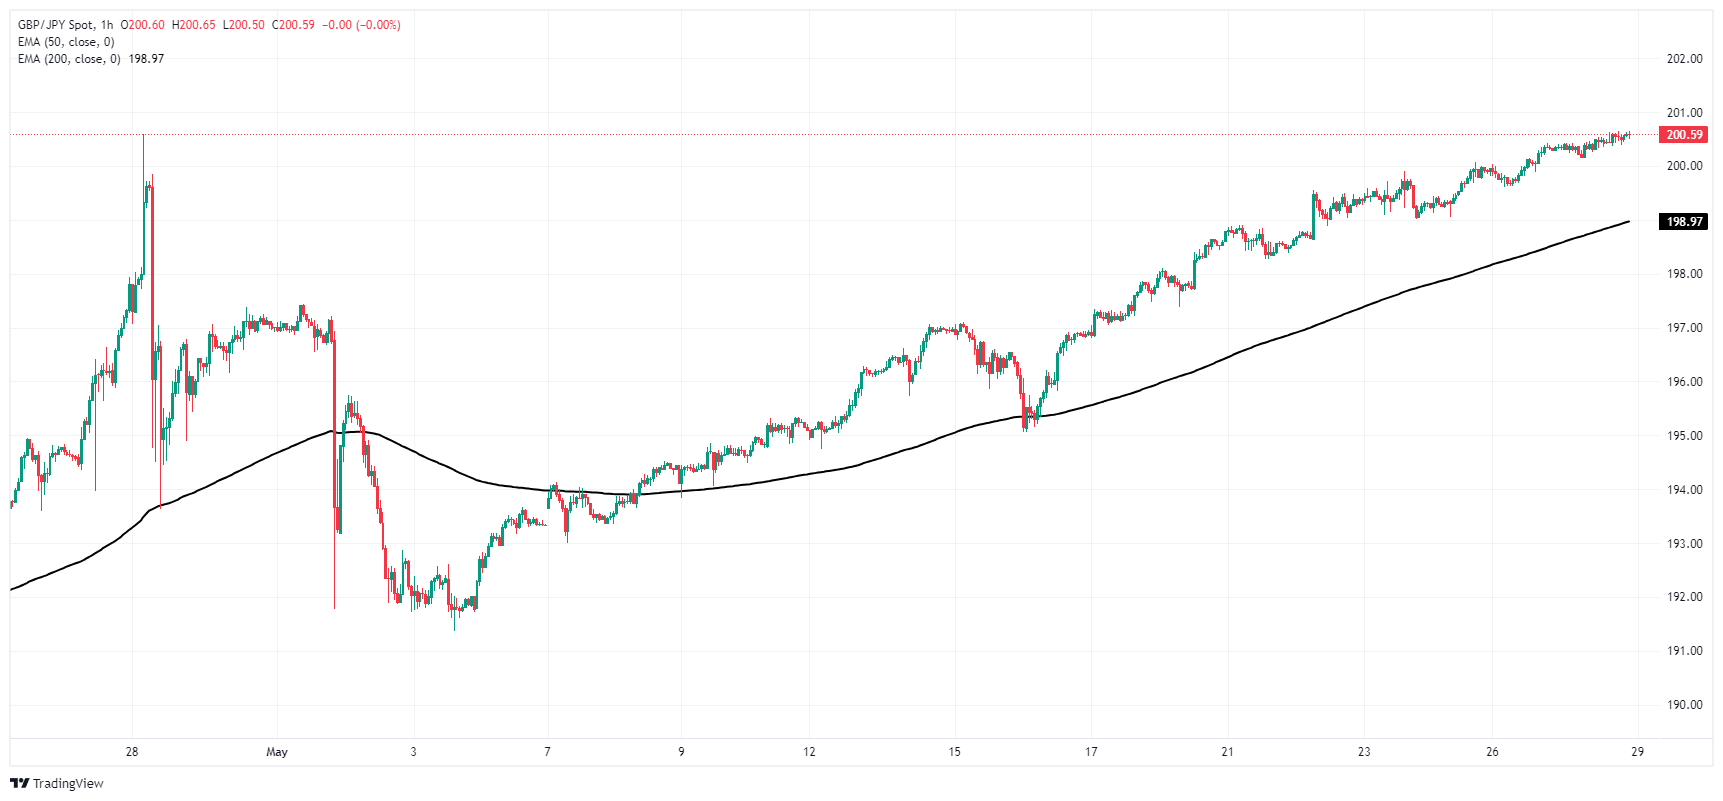
GBP/JPY hourly chart
GBP/JPY daily chart
GBP/JPY
| OVERVIEW | |
|---|---|
| Today last price | 200.61 |
| Today Daily Change | 0.25 |
| Today Daily Change % | 0.12 |
| Today daily open | 200.36 |
| TRENDS | |
|---|---|
| Daily SMA20 | 196.34 |
| Daily SMA50 | 193.87 |
| Daily SMA100 | 191.14 |
| Daily SMA200 | 187.28 |
| LEVELS | |
|---|---|
| Previous Daily High | 200.43 |
| Previous Daily Low | 199.61 |
| Previous Weekly High | 200.07 |
| Previous Weekly Low | 197.39 |
| Previous Monthly High | 200.59 |
| Previous Monthly Low | 190 |
| Daily Fibonacci 38.2% | 200.12 |
| Daily Fibonacci 61.8% | 199.92 |
| Daily Pivot Point S1 | 199.84 |
| Daily Pivot Point S2 | 199.32 |
| Daily Pivot Point S3 | 199.02 |
| Daily Pivot Point R1 | 200.66 |
| Daily Pivot Point R2 | 200.95 |
| Daily Pivot Point R3 | 201.48 |
More By This Author:
AUD/USD Extends Recovery As Greenback Falters With Aussie Retail Sales In The BarrelUSD/JPY Steady On Friday After Another Week Of Gains
Canadian Dollar Pares Losses On Friday Despite Downturn In Canadian Retail Sales


Comments
Log in or sign up to join the conversation.