
- GBP/CAD is climbing higher within what could be a Rising Wedge price configuration.
- It is currently finding support at the 50-day SMA.
- A decisive break lower could signal substantial further weakness.
GBP/CAD continues trading higher in what looks like a Rising Wedge pattern. Within the confines of the pattern’s borders the pair is finding support at the (red) 50-day Simple Moving Average (SMA) at about 1.7879.
GBP/CAD Daily Chart
(Click on image to enlarge)
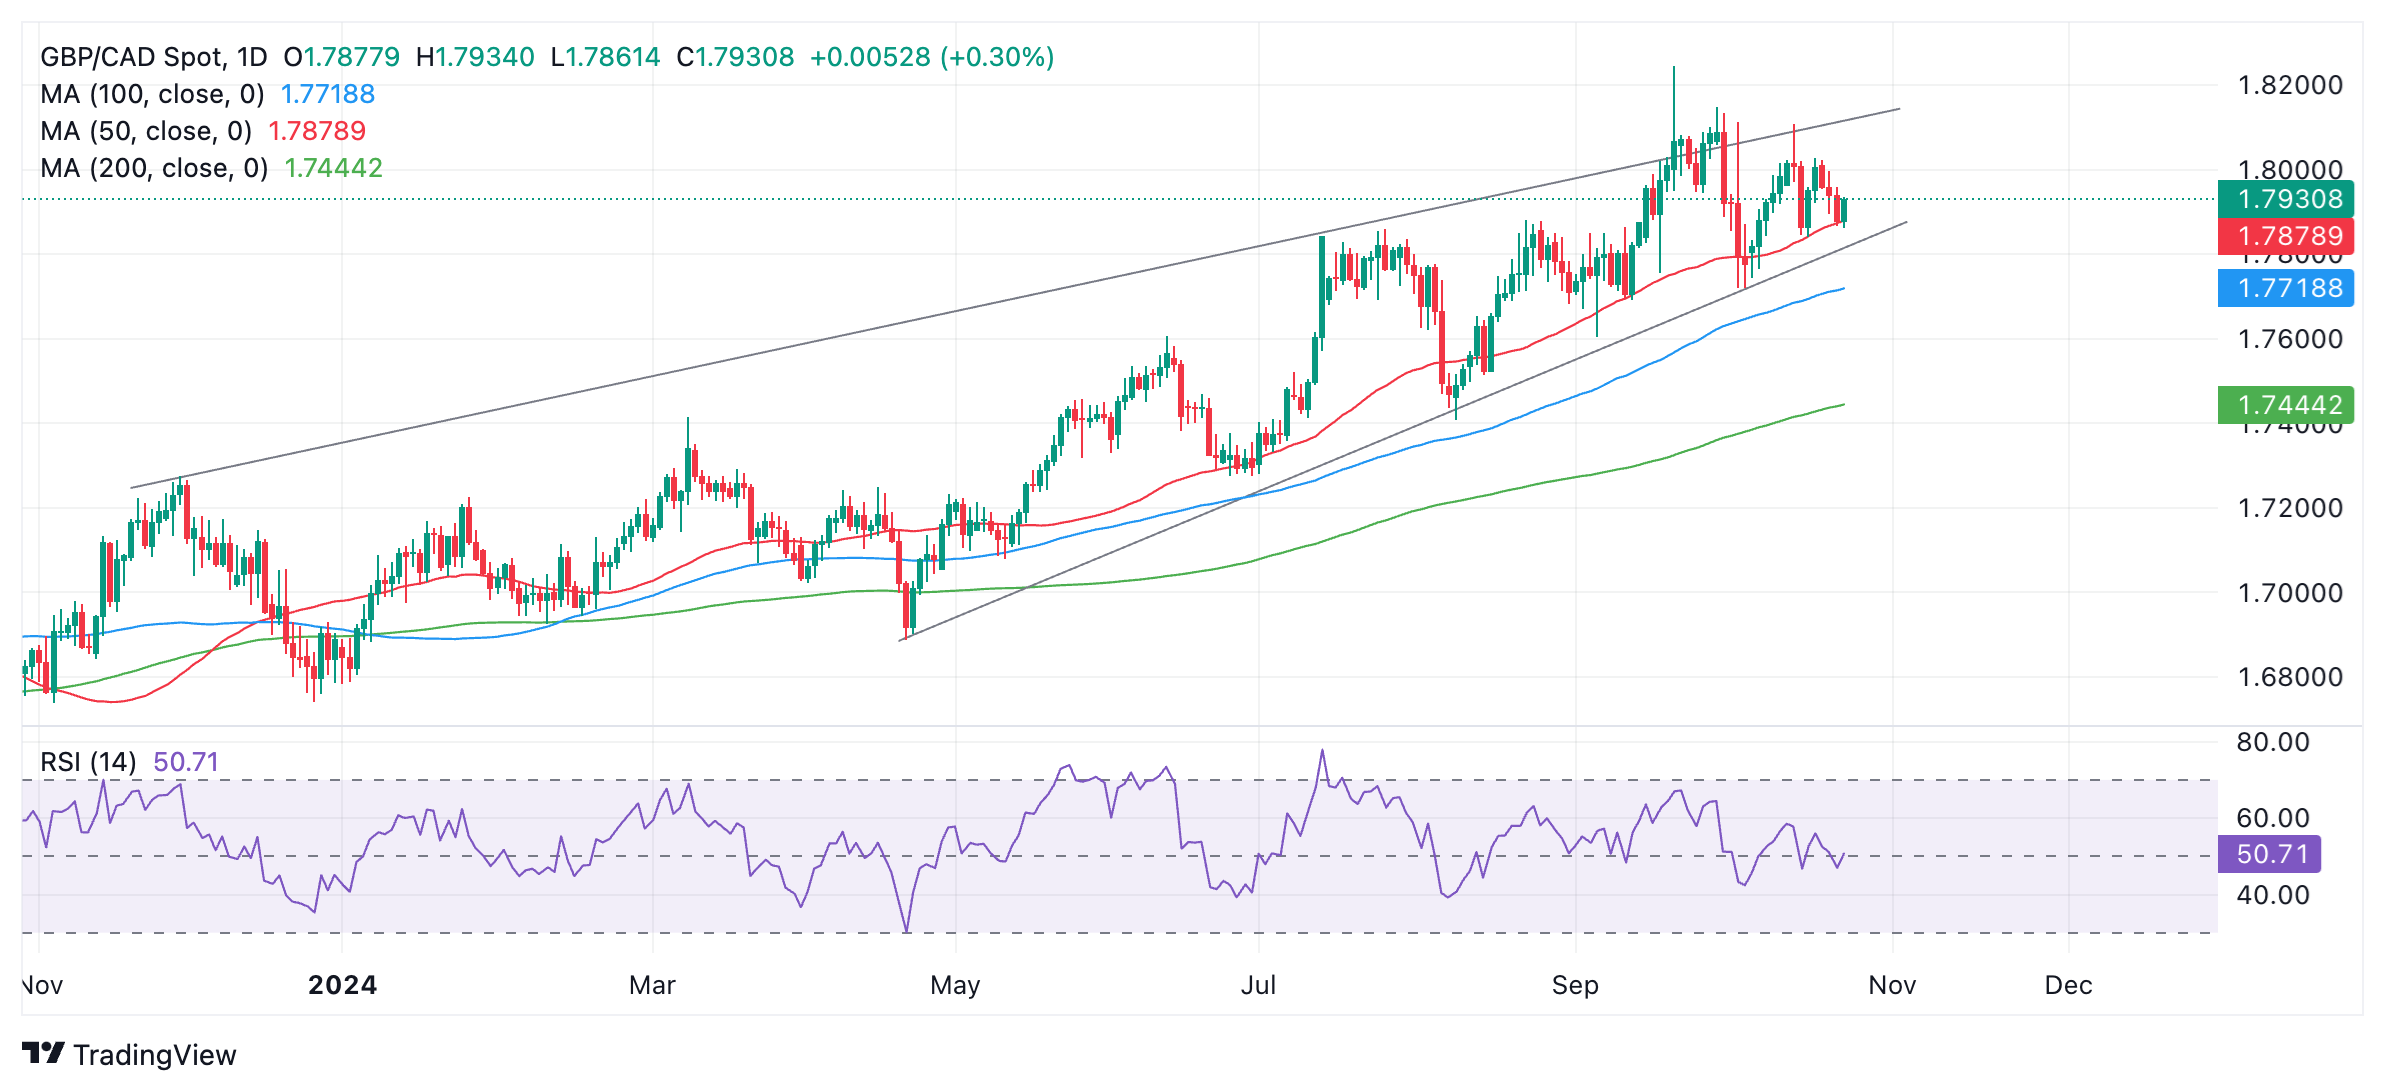
GBP/CAD will probably respect the borders of the pattern and continue rising in line with the medium and long-term bull trend. The short-term trend is less clear and could be classed more specifically as sideways.
A decisive break below the lower trendline of the Rising Wedge would probably signal the start of a steeper descent. Such a breakout lower would be confirmed by a close below 1.7700, and would probably result in a move down to support at the 200-day SMA at around 1.7445.
More By This Author:
USD/CAD Price Forecast: Bulls Have The Upper Hand Despite Corrective Slide, 1.3800 Holds The KeyUSD/CAD Moves Away From Post-BoC Swing High, Slides To 1.3825 On Softer USD
GBP/JPY Rises Over 1.0% As Political Instability Weighs On The Yen


Comments
Log in or sign up to join the conversation.