

Image Source: Unsplash
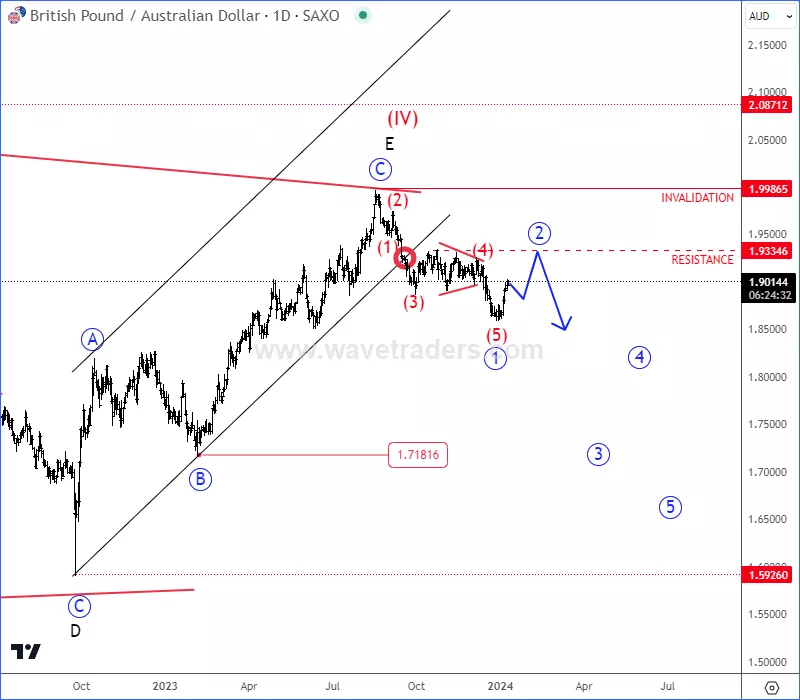
GBP/AUD turned bearish in 2023 on a daily chart, a move that can resume much lower after a break out of the channel and also because a drop from the highs can be impulsive. As such, we are looking for more weakness in 2024, possibly down to around 1.77 but after corrective pullback which appears it takes place now with the rebound since January. We see start of wave 2 rally which can stop at 1.93 resistance.
(Click on image to enlarge)
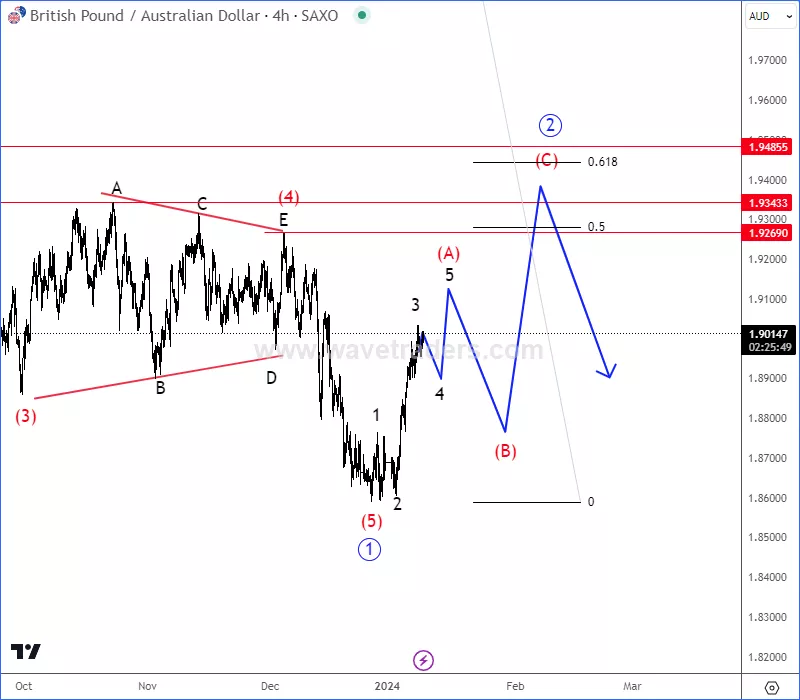
GBP/AUD is in sharp recovery mode in the 4-hour chart after the price dropped out of wave (4) triangle pattern into a wave (5), so we are tracking a higher degree (A)-(B)-(C) correction that can take some time and can retest 1.92 – 1.93, maybe even 1.94 resistance zone before we will see a bearish continuation.
(Click on image to enlarge)
More By This Author:
BTCUSD Is Pointing Higher After A Correction
EUR/JPY Slows Down For A Higher Degree Correction
JP Morgan Is Eyeing 200 Area


Comments
Log in or sign up to join the conversation.