
UK Considers Tax Hikes To Help Plug £50 Billion Hole
Briton’s new prime minister, Rishi Sunak, and finance minister, Jeremy Hunt are considering tax hikes and spending cuts in an attempt to avoid a shortfall of between 30 and 40 billion pounds according to treasury calculations. The £50 billion figure has been floated around due to the fact that efforts to cover the shortfall (tax hikes, spending cuts) will worsen the economic outlook and result in lower collected tax revenue thereafter. Hunt is reportedly exploring increasing the windfall tax on oil and gas companies as an alternative way to reduce the fiscal gap.
Pound Sterling On Track For Third Consecutive Week Of Gains
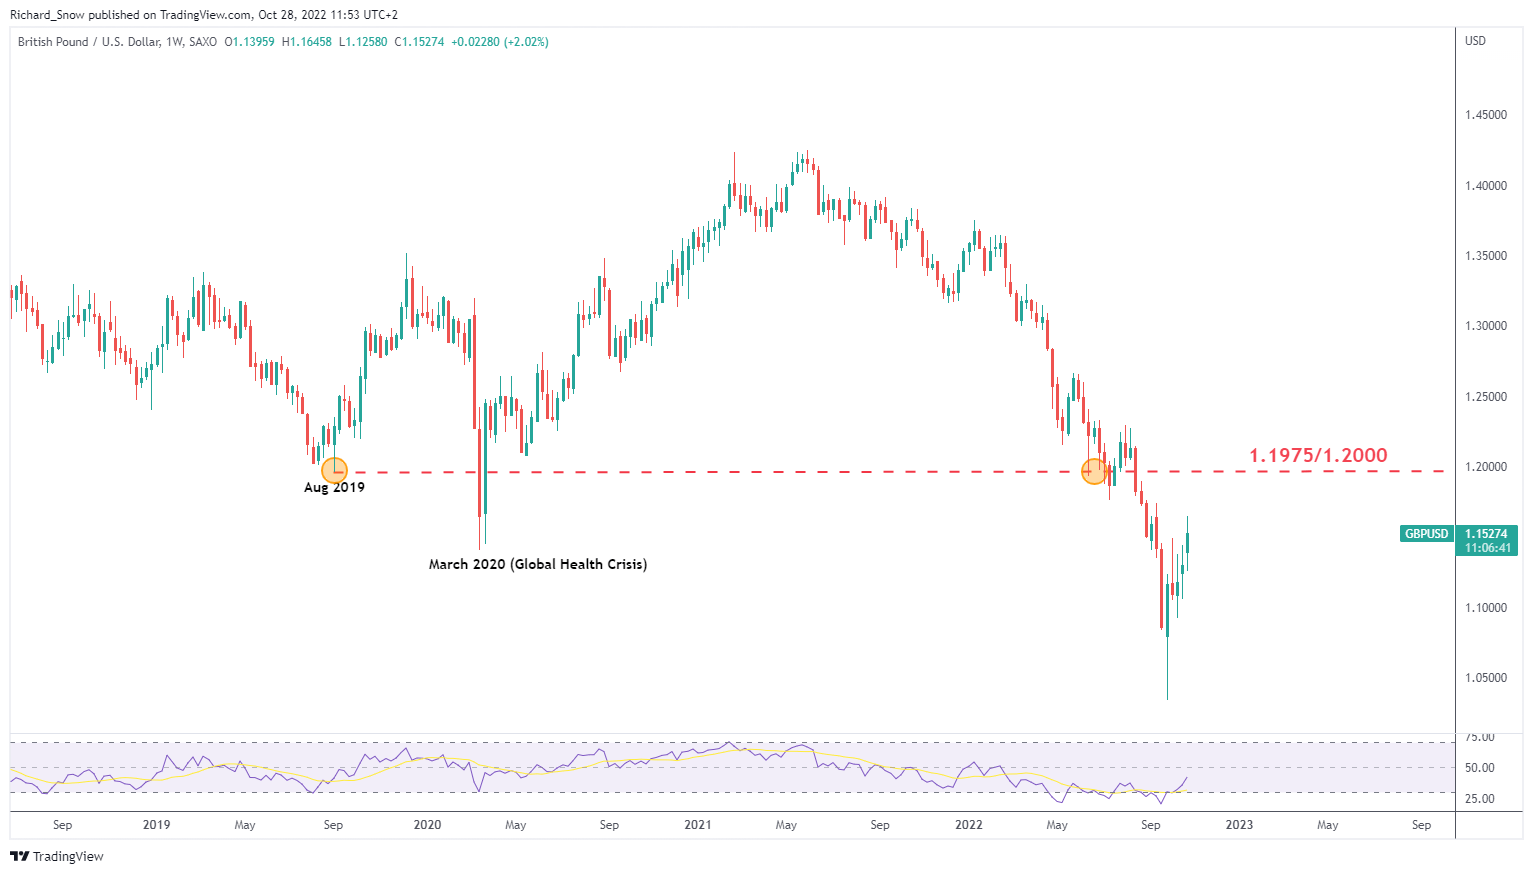
The weekly GBP/USD reveals that despite sterling’s recent woes, the pair is on track to mark three consecutive weeks of gains. Since printing the low in September, GBP/USD has exhibited abnormally high volatility which remains evident via the extended upper and lower wicks – revealing that extreme price moves remain possible, particularly given the shock to the UK bond market and pension fund industry from late September to mid-October.
Now that price action has surpassed the March 2020 low, the 1.1975-1.2000 psychological level appears as the next significant level of resistance however, there are a few levels on the daily chart to be aware of.
Daily GBP/USD Weekly Chart
(Click on image to enlarge)
Source: TradingView, prepared by Richard Snow
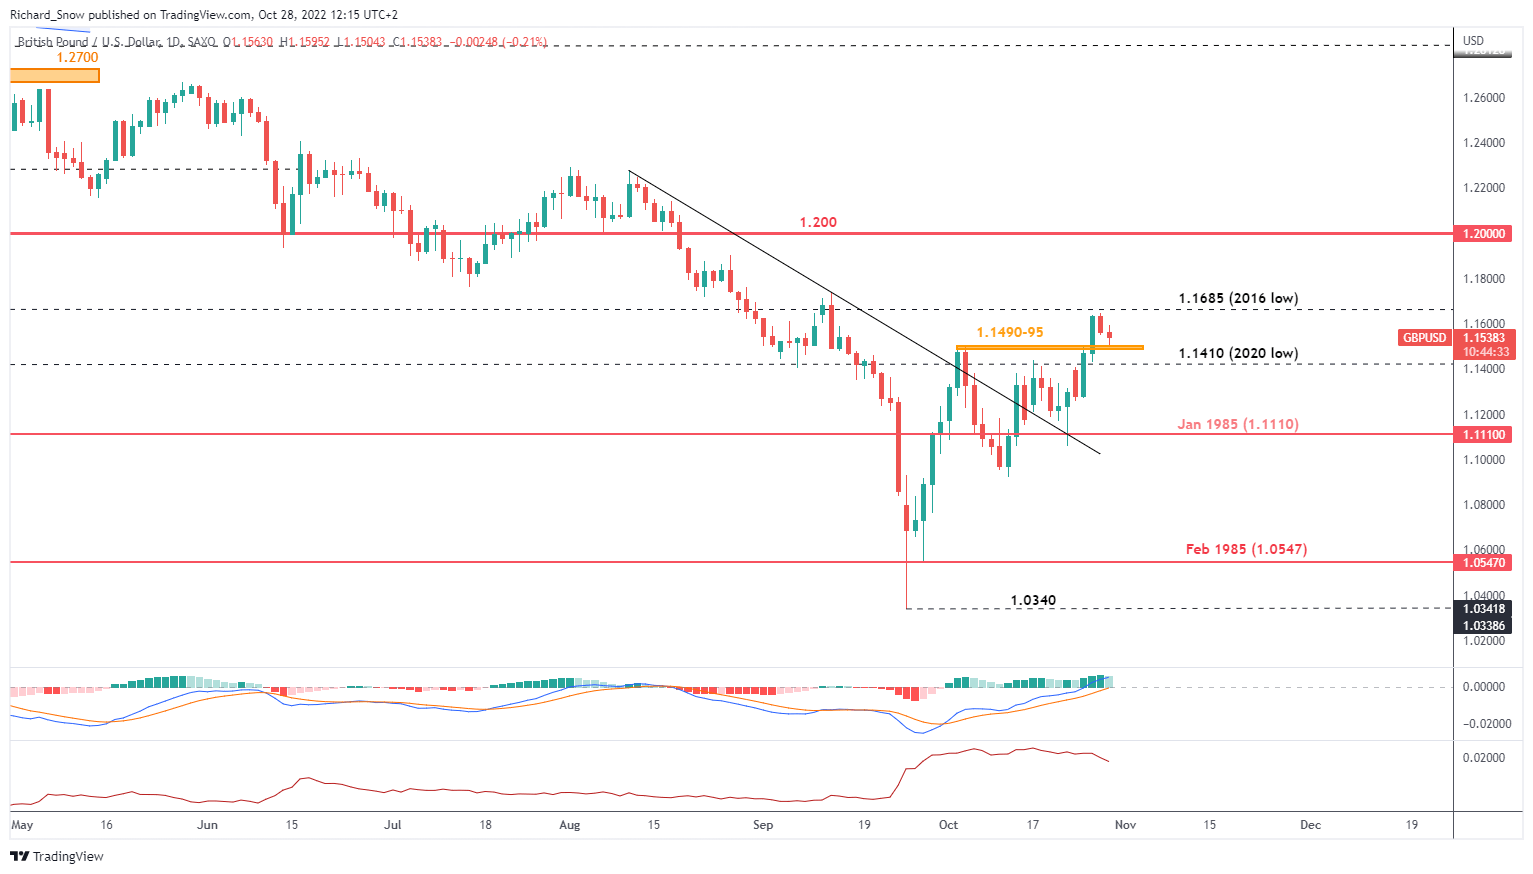
The daily chart shows the GBP/USD attempt at a bullish reversal which is somewhat misleading given the massive drop. The pair has actually only rallied 2.6% or just under 300 pips since the moment of madness that ensued after the announcement of the UK mini-budget. While the move is not insignificant, it is certainly way too soon to suggest with conviction that a longer-term bullish reversal is underway. Prices are still a long way from the 1.4200 highs seen in 2021.
Price action appears to have rejected the 2016 low of 1.1685 and currently tests the 1.1490-95 zone (prior high) as support, followed by 1.1410 (2020 low). If we are to see a bullish continuation above 1.1685 then the next big level of resistance resides at the previously mentioned 1.2000 level.
Daily GBP/USD Daily Chart
(Click on image to enlarge)
Source: TradingView, prepared by Richard Snow
PCE Data, BoE, And Fed Rate Meetings To Provide GBP/USD Direction
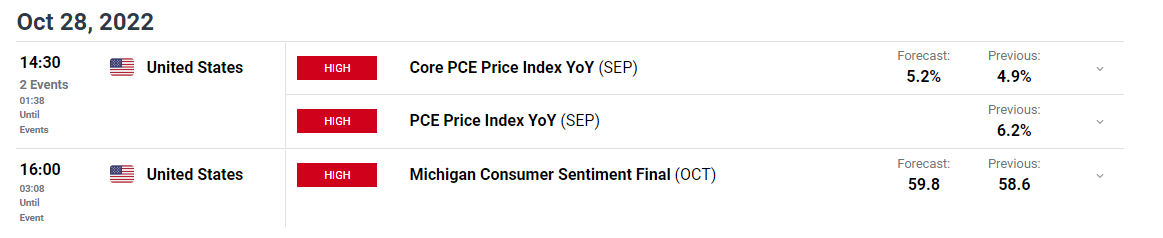
Today’s PCE data will be weighed up against the upward surprise in CPI earlier this month as the FOMC convenes ahead of the November 2nd rate meeting. The recent dollar weakness was spurred by comments from the Fed’s Mary Daly as she cautioned against overtightening and welcomed the idea of lower incremental hikes in future rate-setting meetings. However, if PCE data reveals that inflation remains stubbornly high and the Fed doubles down on its fight against inflation with a mention of further aggressive hikes, we could very well see a return to dollar strength and rising treasury yields from the current lower levels – GBP/USD lower.
Customize and filter live economic data via our DaliyFX economic calendar
More By This Author:
Euro Breaking News: Inflation In Focus After German GDP Surprises HigherApple Falls in After-Hours Trading as iphone Sales, Services Miss Estimates
Meta Plunges Over 13% on Grim Earnings After Nasdaq Sinks


Comments
Log in or sign up to join the conversation.