
EUR/USD Rallies To Two-Month-Highs, US Dollar Extends Fall After NFP
US DOLLAR DROP CONTINUES AFTER NFP
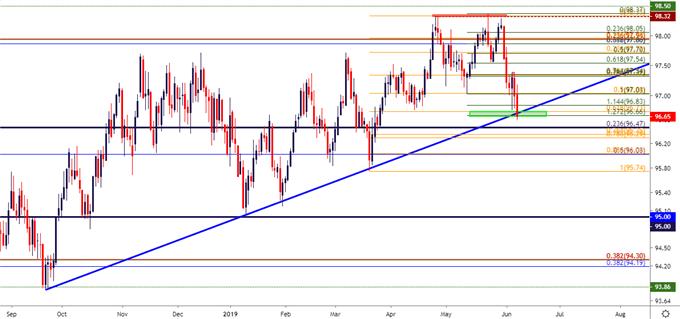
US Dollar weakness has continued as sellers have pushed the currency to fresh two-month-lows, breaching below a batch of support that came-in earlier this week around the prior April swing-lows. At the source of this week’s move has been the fast change around US rate expectations for 2019. Coming into this year, the Fed had forecast two hikes for this year. At this point, markets are looking for as many as three cuts, marking a big change-of-pace as a number of risk items have emerged.
The US Dollar is now testing below trend-line support from the ascending triangle formation that had helped to hold the lows since last September. This exposes deeper support potential at areas such as 96.47, which is the 23.6% Fibonacci retracement of the 2011-2017 major move; or perhaps even the confluent area around the 96.00-level which was last in-play as support in February and March.
US DOLLAR DAILY PRICE CHART
EUR/USD JUMPS TO RESISTANCE AT APRIL HIGHS AFTER US DOLLAR DROP EXTENDS
Going along with that continuation of weakness in the US Dollar is a bullish theme that’s recently shown in EURUSD price action. This was an especially pensive week for the single currency, considering the ECB rate decision on Thursday to go along with a plethora of technical themes. The net response in EUR/USD to this week’s batch of risk has been a move that’s probably surprising to many, as the pair has continued to march-higher on the chart after the failed bearish breakout from last week.
As looked at on Tuesday, bullish aspirations were beginning to show on the EURUSD chart; and the support and resistance zones shown in that article continue to hold bearing. The resistance zone from 1.1250-1.1262 helped to cap the advance into this morning’s NFP report, after which price action made a quick run up to the next resistance area at 1.1325. And yesterday’s ECB rate decision assisted with the further development of that topside theme, as a quick pullback found support in a key zone that runs from 1.1187-1.1212. Also assisting with that support is a prior bearish trend-line that was taken out earlier this week.
EUR/USD FOUR-HOUR PRICE CHART
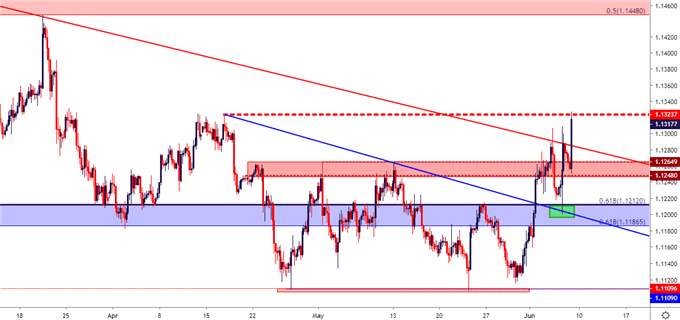
Chart prepared by James Stanley


