

Image Source: Pixabay
- EUR/USD remains tepid around the major level amid a bearish sentiment.
- A breach below the 1.0600 level may lead the pair toward November’s low at 1.0517.
- The nine-day EMA at 1.0675 appears as the immediate barrier.
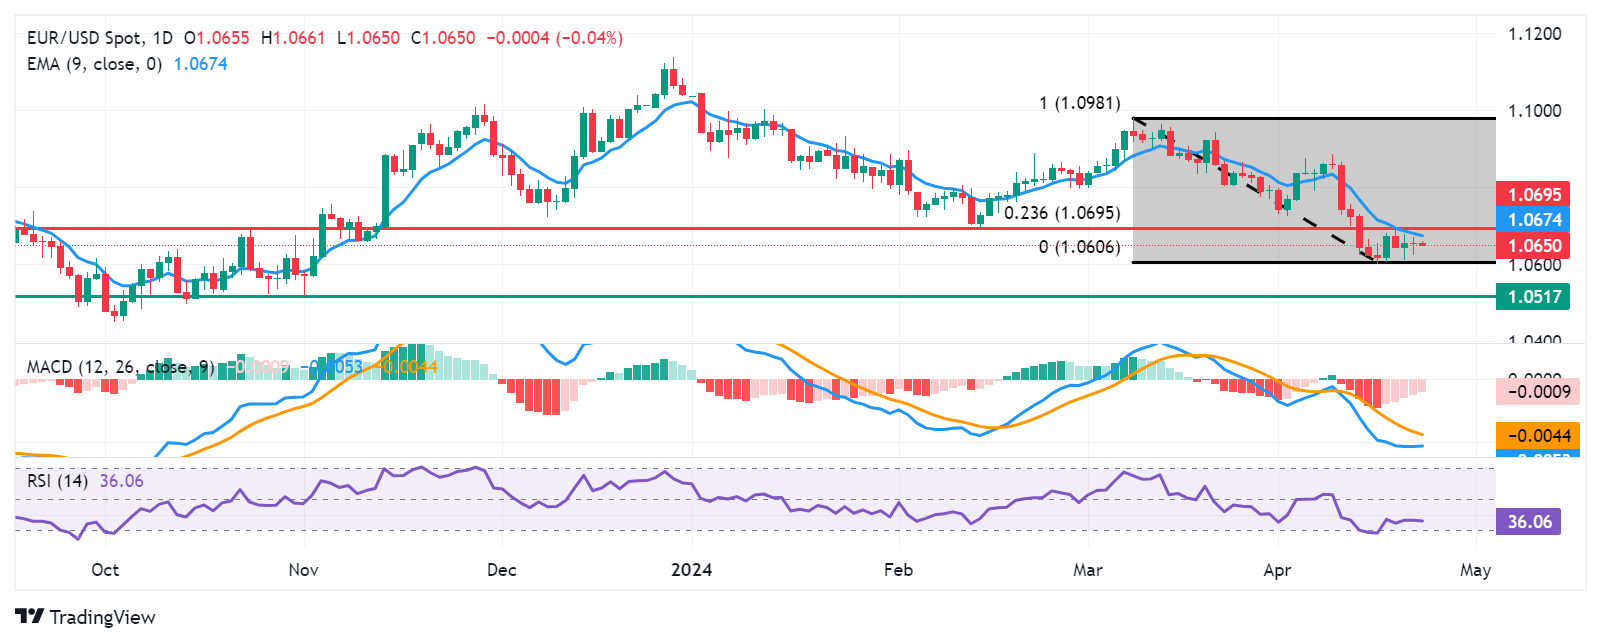
EUR/USD remains lackluster during the Asian trading hours on Tuesday, hovering near 1.0650. From a technical perspective, analysis suggests a bearish sentiment for the pair as it struggles below the pullback resistance at the 1.0695 level. The 14-day Relative Strength Index (RSI) also remains below the 50 mark.
Moreover, the lagging indicator, Moving Average Convergence Divergence (MACD), indicates weakness for the EUR/USD pair as it resides below the centerline and the signal line. Key support for the pair could be found around the psychological level of 1.0600.
A breach below this level may exert downward pressure on the pair, leading it towards the region around the major support level of 1.0550, followed by November’s low at 1.0517.
On the upside, the immediate barrier for the EUR/USD pair could be the nine-day Exponential Moving Average (EMA) at 1.0675. A breakthrough above this level could lead the pair to reach the 1.0695 level, aligning with the 23.6% Fibonacci retracement level drawn between 1.0981 and 1.0606.
Further resistance aligns with the psychological level of 1.0700. A breakthrough above this region could potentially strengthen the recovery sentiment for the pair.
EUR/USD: Daily Chart
EUR/USD
| OVERVIEW | |
|---|---|
| Today last price | 1.0652 |
| Today Daily Change | -0.0003 |
| Today Daily Change % | -0.03 |
| Today daily open | 1.0655 |
| TRENDS | |
|---|---|
| Daily SMA20 | 1.0748 |
| Daily SMA50 | 1.0808 |
| Daily SMA100 | 1.0851 |
| Daily SMA200 | 1.0815 |
| LEVELS | |
|---|---|
| Previous Daily High | 1.0671 |
| Previous Daily Low | 1.0624 |
| Previous Weekly High | 1.069 |
| Previous Weekly Low | 1.0601 |
| Previous Monthly High | 1.0981 |
| Previous Monthly Low | 1.0768 |
| Daily Fibonacci 38.2% | 1.0642 |
| Daily Fibonacci 61.8% | 1.0653 |
| Daily Pivot Point S1 | 1.0629 |
| Daily Pivot Point S2 | 1.0603 |
| Daily Pivot Point S3 | 1.0582 |
| Daily Pivot Point R1 | 1.0676 |
| Daily Pivot Point R2 | 1.0697 |
| Daily Pivot Point R3 | 1.0722 |
More By This Author:
USD/JPY Holds Ground As Iran Plans No Immediate Retaliation Against The Israeli AirstrikesGold Price Forecast: XAU/USD Rises Above $2,410 After Reports Of Israeli Attack On Iran
Gold Price Forecast: XAU/USD Rebounds On Market Caution, Aims To Reach $2,400


Comments
Log in or sign up to join the conversation.