EUR/USD Price Analysis: Technical Correction In The Offing?
- EUR/USD fades the earlier uptick to the 1.1270 zone.
- Extreme overbought condition might prompt a correction.
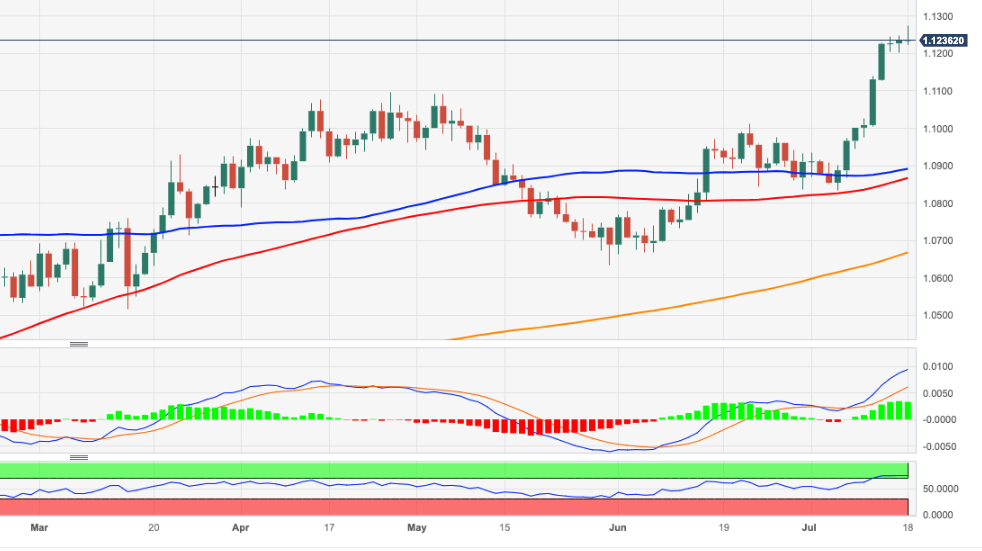
EUR/USD retreats from earlier YTD peaks around 1.1275 on Tuesday.
While the continuation of the upside momentum appears favored in the very near term, the pair’s current overbought conditions (as per the day-to-day RSI near 75) might spark a corrective knee-jerk.
Further north of the 2023 top at 1.1275 (July 18), the pair is expected to meet the next resistance level of note at the 2022 high of 1.1495 recorded on February 10.
Looking at the longer run, the positive view remains unchanged while above the 200-day SMA, today at 1.0666.
EUR/USD daily chart
(Click on image to enlarge)
EUR/USD
| OVERVIEW | |
|---|---|
| Today last price | 1.1235 |
| Today Daily Change | 52 |
| Today Daily Change % | 0.00 |
| Today daily open | 1.1235 |
| TRENDS | |
|---|---|
| Daily SMA20 | 1.0982 |
| Daily SMA50 | 1.0874 |
| Daily SMA100 | 1.086 |
| Daily SMA200 | 1.066 |
| LEVELS | |
|---|---|
| Previous Daily High | 1.1249 |
| Previous Daily Low | 1.1203 |
| Previous Weekly High | 1.1245 |
| Previous Weekly Low | 1.0944 |
| Previous Monthly High | 1.1012 |
| Previous Monthly Low | 1.0662 |
| Daily Fibonacci 38.2% | 1.1231 |
| Daily Fibonacci 61.8% | 1.1221 |
| Daily Pivot Point S1 | 1.1209 |
| Daily Pivot Point S2 | 1.1184 |
| Daily Pivot Point S3 | 1.1164 |
| Daily Pivot Point R1 | 1.1255 |
| Daily Pivot Point R2 | 1.1275 |
| Daily Pivot Point R3 | 1.13 |
More By This Author:
EUR/USD Price Analysis: Initial Hurdle Comes At 1.1250USD Index Fades The Uptick To The 100.00 Region
Natural Gas Futures: A Deeper Retracement Seems On The Table
Disclosure: Information on this article contains forward-looking statements that involve risks and uncertainties. Markets and instruments profiled on this page are for informational purposes ...
more


