EUR/USD Price Analysis: Selling Bias Meets Support Around 1.0850
- EUR/USD picks up some traction and revisits 1.0890.
- The multi-week lows near 1.0850 hold the downside so far.
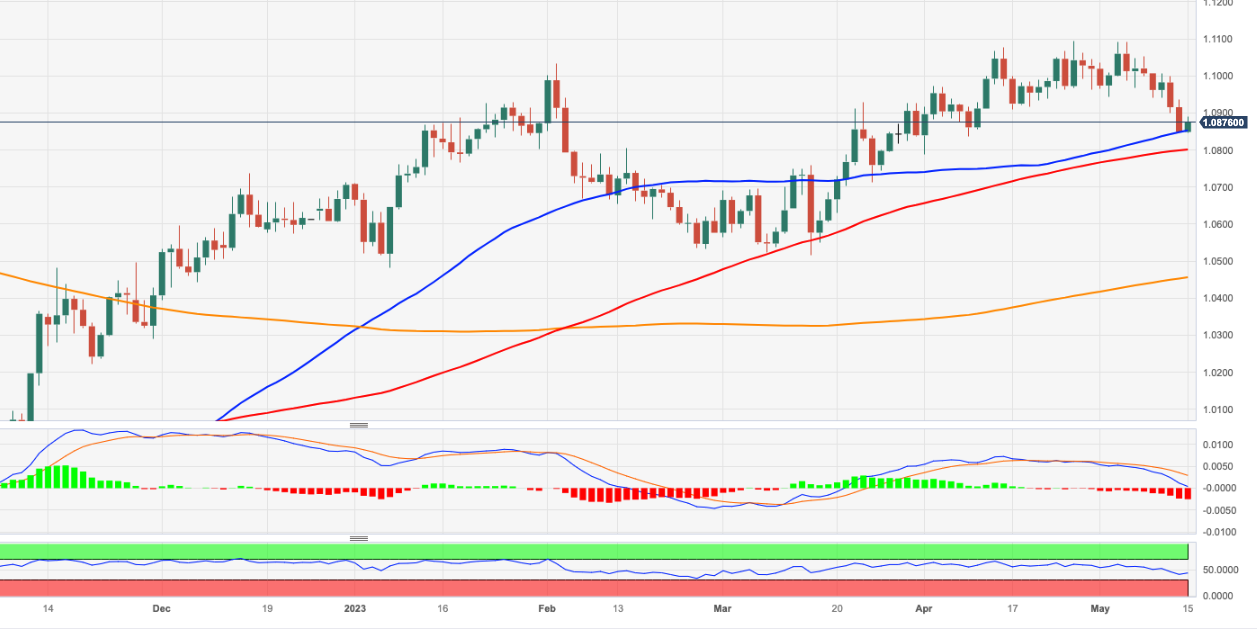
Following a test of the mid-1.0800s – an area coincident with the 55-day SMA – EUR/USD manages to pick up the pace and revisit 1.0890.
Immediately to the upside now comes the psychological 1.1000 hurdle. A sustainable breakout of this hurdle exposes a probable test of the 2023 peak at 1.1095 (April 26) just before the round level at 1.1100.
Looking at the longer run, the constructive view remains unchanged while above the 200-day SMA, today at 1.0454.
EUR/USD daily chart
(Click on image to enlarge)
EUR/USD
| OVERVIEW | |
|---|---|
| Today last price | 1.0877 |
| Today Daily Change | 46 |
| Today Daily Change % | 0.26 |
| Today daily open | 1.0849 |
| TRENDS | |
|---|---|
| Daily SMA20 | 1.0985 |
| Daily SMA50 | 1.0871 |
| Daily SMA100 | 1.0799 |
| Daily SMA200 | 1.0453 |
| LEVELS | |
|---|---|
| Previous Daily High | 1.0936 |
| Previous Daily Low | 1.0848 |
| Previous Weekly High | 1.1054 |
| Previous Weekly Low | 1.0848 |
| Previous Monthly High | 1.1095 |
| Previous Monthly Low | 1.0788 |
| Daily Fibonacci 38.2% | 1.0881 |
| Daily Fibonacci 61.8% | 1.0902 |
| Daily Pivot Point S1 | 1.0819 |
| Daily Pivot Point S2 | 1.079 |
| Daily Pivot Point S3 | 1.0732 |
| Daily Pivot Point R1 | 1.0907 |
| Daily Pivot Point R2 | 1.0965 |
| Daily Pivot Point R3 | 1.0994 |
More By This Author:
Natural Gas Futures: Door Open To Further GainsWTI Rebounds From An Earlier Drop To $70.00, Looks At Data
USD Index Price Analysis: Next On The Upside Comes 102.40
Disclosure: Information on this article contains forward-looking statements that involve risks and uncertainties. Markets and instruments profiled on this page are for informational purposes ...
moreComments
Please wait...
Comment posted successfully
No Thumbs up yet!


