

Image Source: Pixabay
- EUR/USD could test the resistance zone around the 50-day EMA and a three-week high.
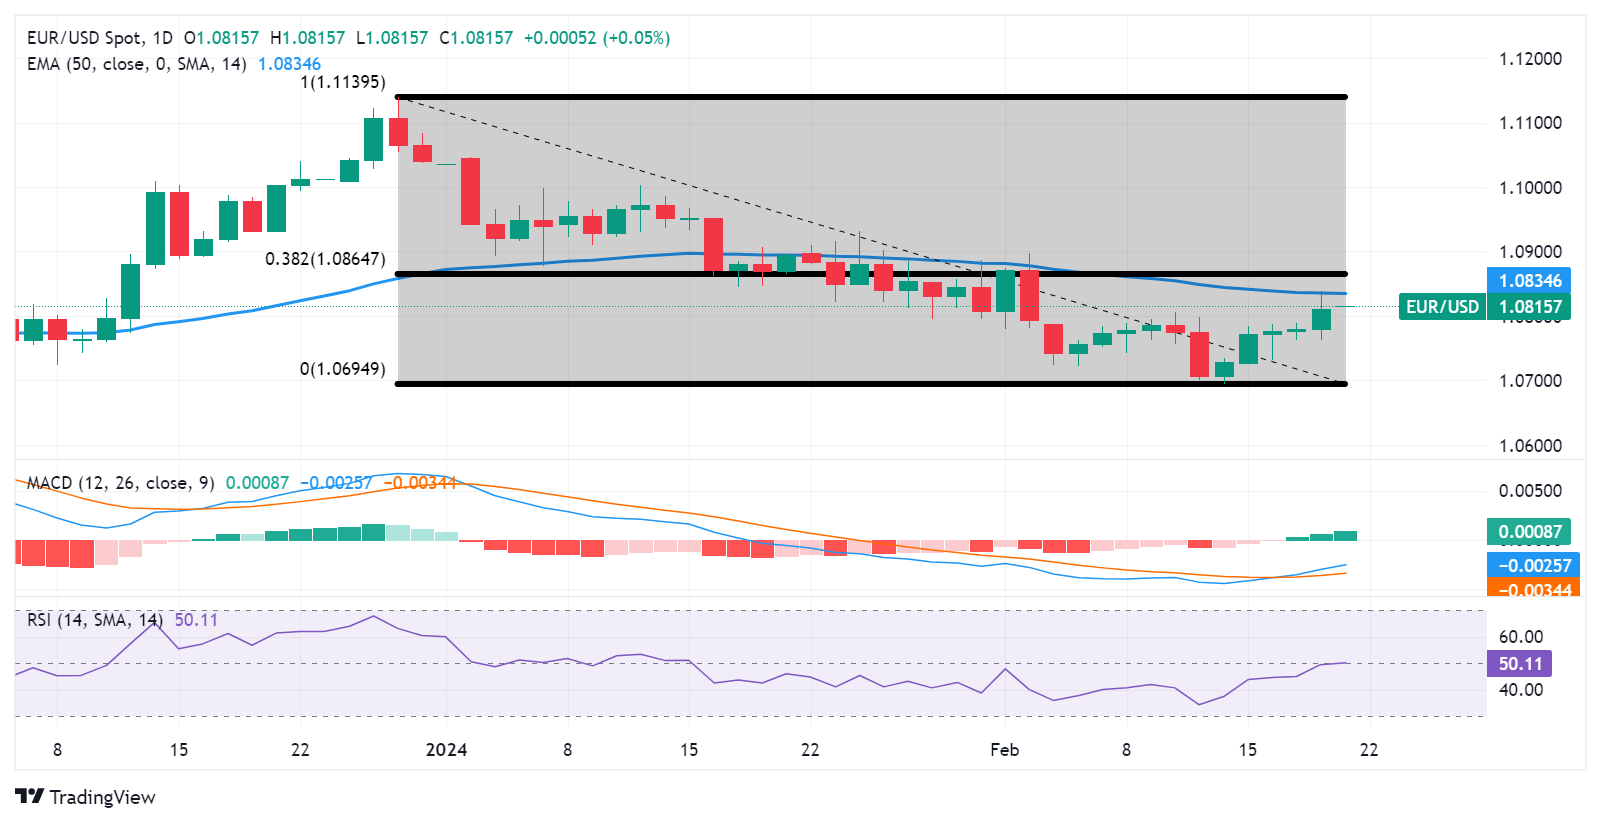
- A break above the major level of 1.0850 could lead the pair to reach a 38.2% Fibonacci retracement at 1.0864.
- Technical indicators suggest a momentum shift towards an upward direction.
EUR/USD continues its winning streak that began on February 14 as the US Dollar (USD) receives downward pressure, which in turn, underpins the EUR/USD pair. The pair edges higher around 1.0810 during the Asian session on Wednesday.
The EUR/USD pair could rise to test the immediate resistance zone around the 50-day Exponential Moving Average (EMA) at 1.0834 and the three-week high at 1.0838. A breakthrough above this zone could exert upward support for the pair to reach the major support at 1.0850 followed by the 38.2% Fibonacci retracement level at 1.0864.
The technical analysis of the EUR/USD pair indicates a potential shift towards upward momentum. While the 14-day Relative Strength Index (RSI) sits at the 50 mark, signaling a neutral stance, the Moving Average Convergence Divergence (MACD) lies below the centreline but shows a divergence above the signal line. Traders may await further confirmation from the MACD to determine a clear directional trend.
On the downside, the immediate support appears at the psychological level at 1.0800 followed by the recent low at 1.0761 recorded on Tuesday. A break below the latter could put downward pressure on the EUR/USD pair to navigate the major support level of 1.0750 with an aim to approach the psychological support at 1.0700.
EUR/USD: Daily Chart
EUR/USD: OTHER IMPORTANT LEVELS TO WATCH
| OVERVIEW | |
|---|---|
| Today last price | 1.0816 |
| Today Daily Change | 0.0006 |
| Today Daily Change % | 0.06 |
| Today daily open | 1.081 |
| TRENDS | |
|---|---|
| Daily SMA20 | 1.0795 |
| Daily SMA50 | 1.0891 |
| Daily SMA100 | 1.0804 |
| Daily SMA200 | 1.0827 |
| LEVELS | |
|---|---|
| Previous Daily High | 1.0839 |
| Previous Daily Low | 1.0762 |
| Previous Weekly High | 1.0806 |
| Previous Weekly Low | 1.0695 |
| Previous Monthly High | 1.1046 |
| Previous Monthly Low | 1.0795 |
| Daily Fibonacci 38.2% | 1.0809 |
| Daily Fibonacci 61.8% | 1.0791 |
| Daily Pivot Point S1 | 1.0769 |
| Daily Pivot Point S2 | 1.0727 |
| Daily Pivot Point S3 | 1.0692 |
| Daily Pivot Point R1 | 1.0846 |
| Daily Pivot Point R2 | 1.0881 |
| Daily Pivot Point R3 | 1.0923 |
More By This Author:
NZD/USD Snaps The Five-Day Winning Streak Above 0.6160, FOMC Minutes Eyed
USD/JPY Price Analysis: Drops Below 150.00 As U.S. Yields Weigh On Us Dollar
GBP/USD Climbs Amid Optimistic BoE’s UK Economic Outlook


Comments
Log in or sign up to join the conversation.