

Image Source: Pixabay
- EUR/USD could approach the major support at 1.0750 following February’s low at 1.0694.
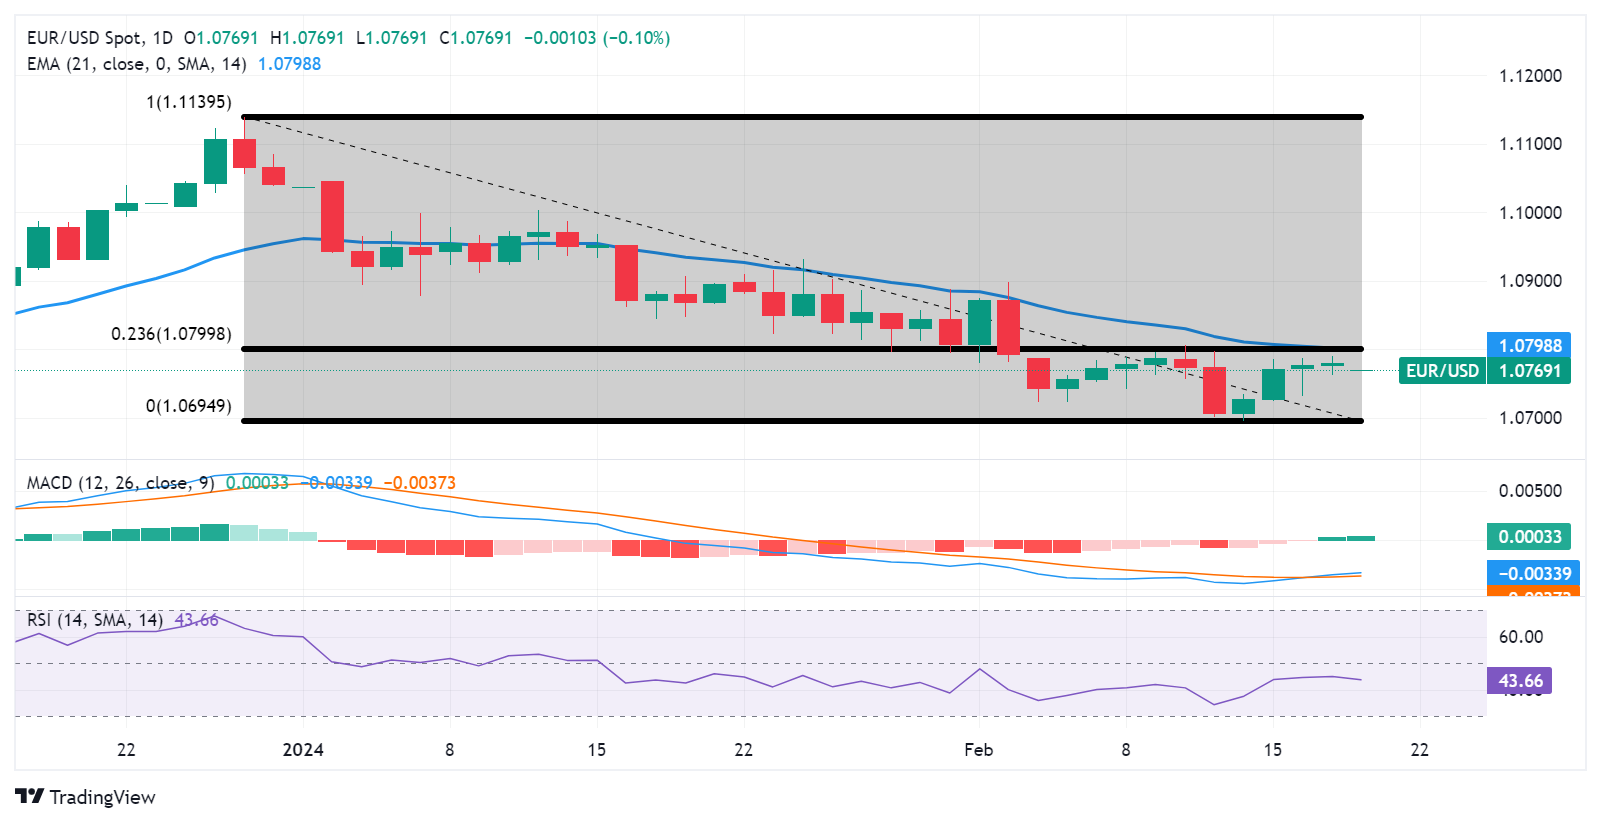
- The resistance zone could be found around the 21-day EMA at 1.0798 and the 23.6% Fibonacci retracement at 1.0799.
- Traders may await the lagging indicator MACD to confirm a directional trend.
EUR/USD retreats from the weekly high of 1.0789, which was recorded on Monday, snapping a four-day winning streak. The pair trades lower around 1.0770 during the Asian hours on Tuesday with positioning above the immediate support at the psychological level of 1.0750.
A break below the latter could put weight on the EUR/USD pair to navigate the further support region around the psychological level of 1.0700, in conjunction with February’s low at 1.0694, which was observed on February 14.
The EUR/USD pair could find the key resistance zone around the 21-day Exponential Moving Average (EMA) at 1.0798 lined up with the 23.6% Fibonacci retracement at 1.0799 and the psychological level of 1.0800.
A firm breakthrough above the resistance zone could exert upward support on the EUR/USD pair to explore the further major barrier at 1.0850, to revisit February’s high at 1.0897 aligned with the psychological level of 1.0900.
The technical analysis of the EUR/USD pair suggests a mixed outlook in the market. The 14-day Relative Strength Index (RSI) is below the 50 mark, indicating a bearish momentum. However, the lagging indicator Moving Average Convergence Divergence (MACD), although still below the centerline, is above the signal line, suggesting a tepid momentum in the market.
Given these conflicting signals, market participants may choose to await further confirmation from the MACD indicator on the directional trend for the EUR/USD pair.
EUR/USD: Daily Chart
EUR/USD: OTHER TECHNICAL LEVELS TO WATCH
| OVERVIEW | |
|---|---|
| Today last price | 1.0768 |
| Today Daily Change | -0.0011 |
| Today Daily Change % | -0.10 |
| Today daily open | 1.0779 |
| TRENDS | |
|---|---|
| Daily SMA20 | 1.0797 |
| Daily SMA50 | 1.0891 |
| Daily SMA100 | 1.08 |
| Daily SMA200 | 1.0827 |
| LEVELS | |
|---|---|
| Previous Daily High | 1.079 |
| Previous Daily Low | 1.0762 |
| Previous Weekly High | 1.0806 |
| Previous Weekly Low | 1.0695 |
| Previous Monthly High | 1.1046 |
| Previous Monthly Low | 1.0795 |
| Daily Fibonacci 38.2% | 1.0779 |
| Daily Fibonacci 61.8% | 1.0773 |
| Daily Pivot Point S1 | 1.0765 |
| Daily Pivot Point S2 | 1.075 |
| Daily Pivot Point S3 | 1.0737 |
| Daily Pivot Point R1 | 1.0792 |
| Daily Pivot Point R2 | 1.0804 |
| Daily Pivot Point R3 | 1.0819 |
More By This Author:
GBP/USD Edges Lower To Near 1.2580 On improved US Dollar, UK PMI, FOMC Minutes AwaitedAUD/USD Loses Ground Below The Mid-0.6500s, Eyes On RBA Meeting Minutes, PBoC Rate Decision
AUD/USD Buckles Down Ahead Of RBA, Testing 0.6550


Comments
Log in or sign up to join the conversation.