EUR/USD Price Analysis: Next Up Barrier Of Note Comes At 2023 High
Image Source: Unsplash
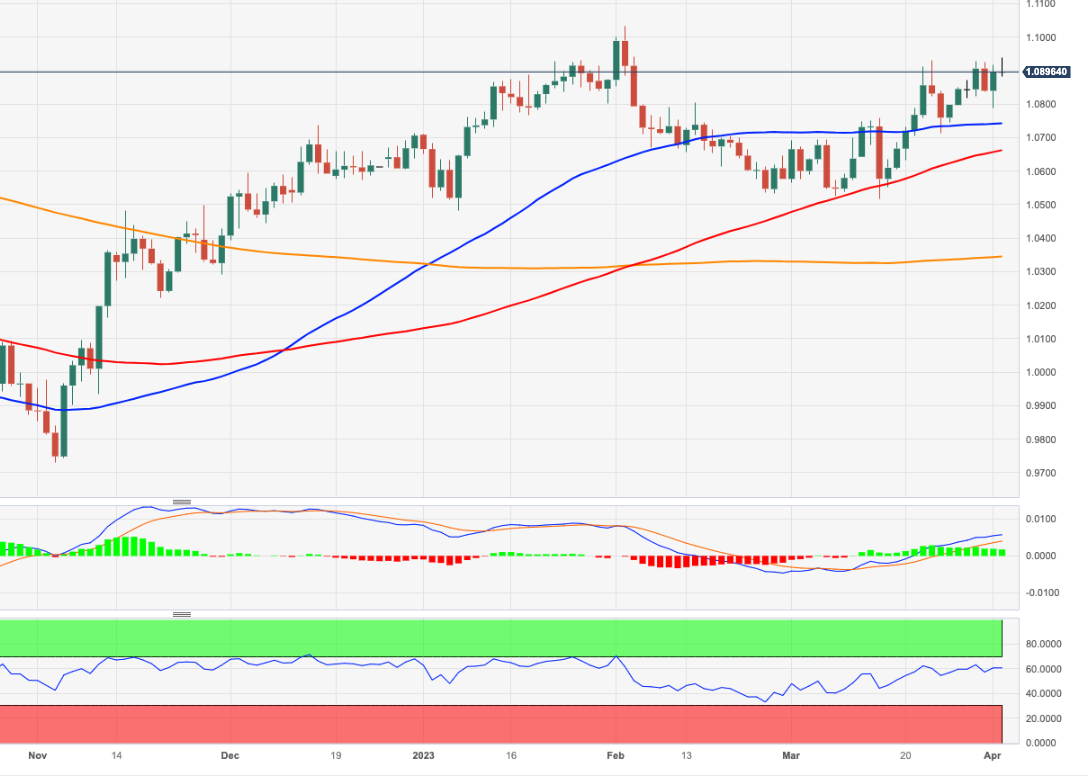
- EUR/USD fades the earlier bull run to new tops near 1.0940.
- Bulls now shift their attention to the YTD peak near 1.1030.
EUR/USD climbs to new multi-week highs near 1.0940 and deflates afterward following a late bounce in the dollar.
The likelihood of extra advances appears favored for the time being. Against that, the pair needs to clear the April high at 1.0938 (April 4) before a potential test of 2023 high at 1.1032 (February 2).
Looking at the longer run, the constructive view remains unchanged while above the 200-day SMA, today at 1.0343.
EUR/USD daily chart
(Click on image to enlarge)
EUR/USD
| OVERVIEW | |
|---|---|
| Today last price | 1.0893 |
| Today Daily Change | 56 |
| Today Daily Change % | -0.04 |
| Today daily open | 1.0897 |
| TRENDS | |
|---|---|
| Daily SMA20 | 1.0735 |
| Daily SMA50 | 1.0732 |
| Daily SMA100 | 1.0657 |
| Daily SMA200 | 1.0343 |
| LEVELS | |
|---|---|
| Previous Daily High | 1.0917 |
| Previous Daily Low | 1.0788 |
| Previous Weekly High | 1.0926 |
| Previous Weekly Low | 1.0745 |
| Previous Monthly High | 1.093 |
| Previous Monthly Low | 1.0516 |
| Daily Fibonacci 38.2% | 1.0868 |
| Daily Fibonacci 61.8% | 1.0837 |
| Daily Pivot Point S1 | 1.0818 |
| Daily Pivot Point S2 | 1.0739 |
| Daily Pivot Point S3 | 1.0689 |
| Daily Pivot Point R1 | 1.0946 |
| Daily Pivot Point R2 | 1.0996 |
| Daily Pivot Point R3 | 1.1075 |
More By This Author:
Natural Gas Futures: No Changes To The Consolidation Theme
Natural Gas Futures: Scope For Extra Gains
Crude Oil Futures: Scope For Extra Gains
Disclosure: Information on this article contains forward-looking statements that involve risks and uncertainties. Markets and instruments profiled on this page are for informational purposes ...
more


