EUR/USD Price Analysis: Next On The Upside Comes 1.0945
- EUR/USD fades Thursday’s downtick and approaches 1.0900.
- Immediate up-barrier remains near 1.0950 so far.
EUR/USD manages to set aside part of Thursday’s sharp pullback and gradually approaches the 1.0900 mark on Friday.
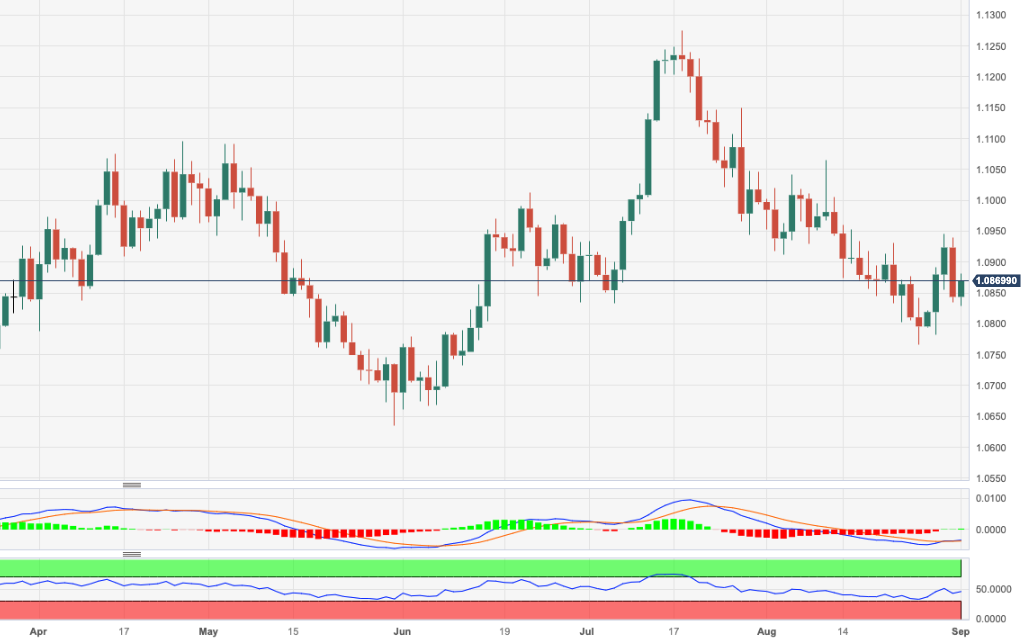
Despite the daily knee-jerk, the pair’s current momentum seems to be favouring the continuation of the march north for the time being. That said, the next hurdle emerges at the weekly top at 1.0945 (August 30), prior to the interim 55-day SMA at 1.0965 and the psychological 1.1000 mark.
In the meantime, the pair is likely to keep the bullish outlook unchanged while above the 200-day SMA, today at 1.0816.
EUR/USD daily chart
(Click on image to enlarge)
EUR/USD
| OVERVIEW | |
|---|---|
| Today last price | 1.0867 |
| Today Daily Change | 54 |
| Today Daily Change % | 0.21 |
| Today daily open | 1.0844 |
| TRENDS | |
|---|---|
| Daily SMA20 | 1.0899 |
| Daily SMA50 | 1.097 |
| Daily SMA100 | 1.0924 |
| Daily SMA200 | 1.0814 |
| LEVELS | |
|---|---|
| Previous Daily High | 1.094 |
| Previous Daily Low | 1.0835 |
| Previous Weekly High | 1.093 |
| Previous Weekly Low | 1.0766 |
| Previous Monthly High | 1.1065 |
| Previous Monthly Low | 1.0766 |
| Daily Fibonacci 38.2% | 1.0875 |
| Daily Fibonacci 61.8% | 1.09 |
| Daily Pivot Point S1 | 1.0806 |
| Daily Pivot Point S2 | 1.0768 |
| Daily Pivot Point S3 | 1.0702 |
| Daily Pivot Point R1 | 1.091 |
| Daily Pivot Point R2 | 1.0977 |
| Daily Pivot Point R3 | 1.1015 |
More By This Author:
Natural Gas Futures: Rebound Seems Likely Near TermEUR/USD Price Analysis: A Drop To The 200-Day SMA Is Not Ruled Out
Natural Gas Futures: Corrective Move In The Pipeline
Disclosure: Information on this article contains forward-looking statements that involve risks and uncertainties. Markets and instruments profiled on this page are for informational purposes ...
more


