

Image Source: Pixabay
- EUR/USD could retest the previous week’s high of 1.0876.
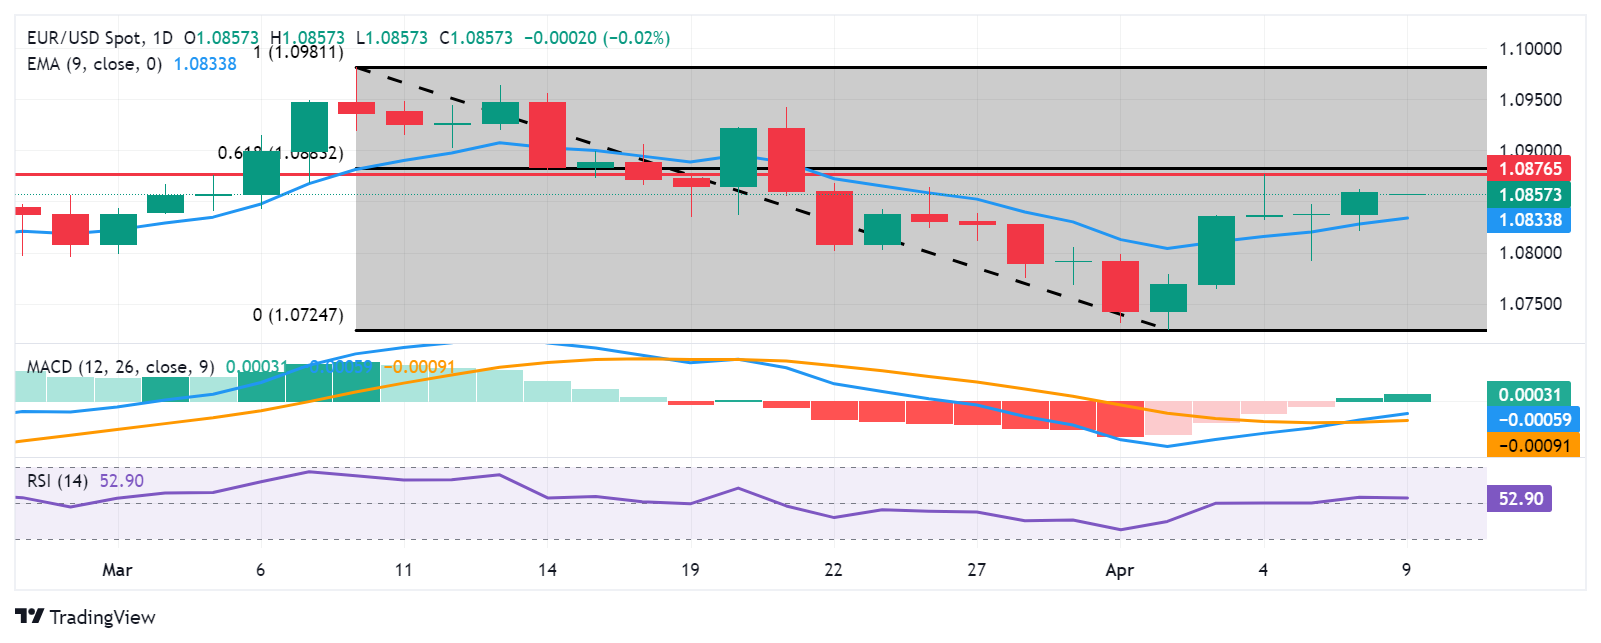
- The resistance zone appears around the 61.8% Fibo level of 1.0883 and the psychological level of 1.0900.
- The major level of 1.0850 could act as a key support, followed by the nine-day EMA at 1.0833.
EUR/USD put efforts to continue its winning streak for the sixth successive session on Tuesday. The pair hovers around 1.0860 during the Asian session. In the daily-frame chart, the pair shows that it is taking support on the nine-day Exponential Moving Average (EMA), which suggests that the pair could move upward to retest the strong resistance at the previous week’s high at 1.0876.
Furthermore, the EUR/USD pair could explore the 61.8% Fibonacci retracement level of 1.0883, followed by the psychological level of 1.0900.
Additionally, technical analysis suggests a bullish sentiment for the EUR/USD pair. The 14-day Relative Strength Index (RSI) is positioned above the 50 mark, indicating strength in buying momentum.
The lagging indicator, Moving Average Convergence Divergence (MACD), shows a divergence above the signal line, which indicates gaining strength for the pair. However, it is still positioned below the centreline. So, the traders are likely to await MACD to offer a clear trend direction.
On the downside, the EUR/USD pair could find immediate support at the major level of 1.0850, followed by the nine-day EMA at 1.0833. A break below this level could lead the pair to navigate the region around the psychological level of 1.0800 following the previous week’s low at 1.0724.
EUR/USD: Daily Chart
EUR/USD
| OVERVIEW | |
|---|---|
| Today last price | 1.0856 |
| Today Daily Change | -0.0003 |
| Today Daily Change % | -0.03 |
| Today daily open | 1.0859 |
| TRENDS | |
|---|---|
| Daily SMA20 | 1.0847 |
| Daily SMA50 | 1.083 |
| Daily SMA100 | 1.0874 |
| Daily SMA200 | 1.0833 |
| LEVELS | |
|---|---|
| Previous Daily High | 1.0862 |
| Previous Daily Low | 1.0821 |
| Previous Weekly High | 1.0876 |
| Previous Weekly Low | 1.0725 |
| Previous Monthly High | 1.0981 |
| Previous Monthly Low | 1.0768 |
| Daily Fibonacci 38.2% | 1.0846 |
| Daily Fibonacci 61.8% | 1.0837 |
| Daily Pivot Point S1 | 1.0833 |
| Daily Pivot Point S2 | 1.0806 |
| Daily Pivot Point S3 | 1.0791 |
| Daily Pivot Point R1 | 1.0874 |
| Daily Pivot Point R2 | 1.0889 |
| Daily Pivot Point R3 | 1.0915 |
More By This Author:
WTI Rises To Near $86.20 On Reports Of Threats Against Israeli EmbassyEUR/GBP Rises To Near 0.8570 Amid Expectations Of Rate Cuts By Major Central Banks
Australian Dollar Edges Higher On Improved Aussie PMI Amid Steady US Dollar


Comments
Log in or sign up to join the conversation.