EUR/USD Price Analysis: Minor Support Emerges Near 1.0840

Image Source: Pixabay
- EUR/USD reverses part of the recent weakness and regains 1.0900.
- So far, there is decent contention around 1.0840.
EUR/USD starts the week on the positive foot and reclaims the area beyond 1.0900 the figure on Monday.
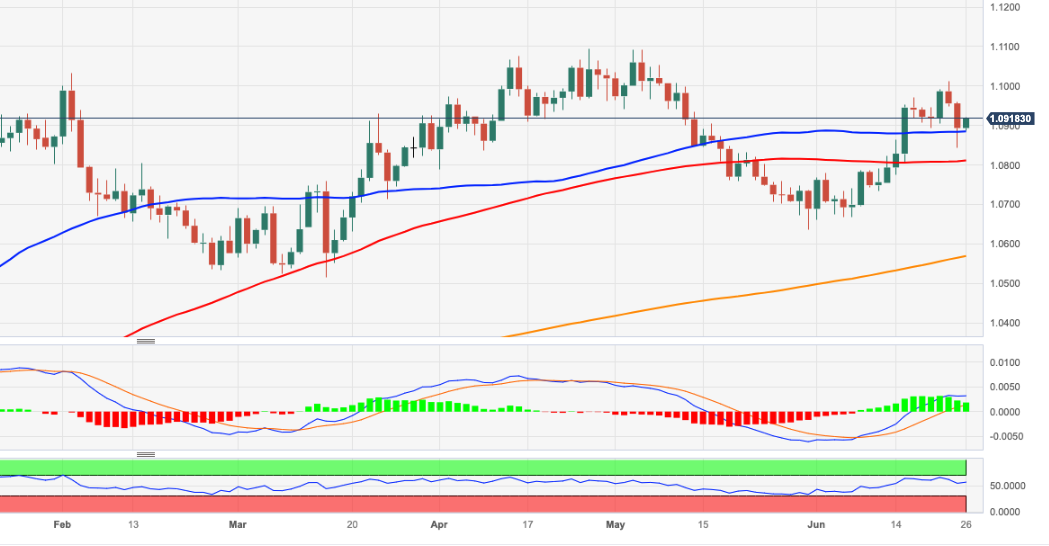
The inability of the pair to regain the area of recent peaks around 1.1010 (June 22) could motivate sellers to return to the market and open the door to a potential revisit to recent weekly lows near 1.0840 (June 23).
The loss of the latter should face the next support of note around the round level of 1.0800, which also appears reinforced by the 100-day SMA (1.0809).
Looking at the longer run, the positive view remains unchanged while above the 200-day SMA, today at 1.0568.
EUR/USD daily chart
(Click on image to enlarge)
EUR/USD
| OVERVIEW | |
|---|---|
| Today last price | 1.0919 |
| Today Daily Change | 33 |
| Today Daily Change % | 0.23 |
| Today daily open | 1.0894 |
| TRENDS | |
|---|---|
| Daily SMA20 | 1.0809 |
| Daily SMA50 | 1.0876 |
| Daily SMA100 | 1.0809 |
| Daily SMA200 | 1.0565 |
| LEVELS | |
|---|---|
| Previous Daily High | 1.096 |
| Previous Daily Low | 1.0844 |
| Previous Weekly High | 1.1012 |
| Previous Weekly Low | 1.0844 |
| Previous Monthly High | 1.1092 |
| Previous Monthly Low | 1.0635 |
| Daily Fibonacci 38.2% | 1.0888 |
| Daily Fibonacci 61.8% | 1.0916 |
| Daily Pivot Point S1 | 1.0839 |
| Daily Pivot Point S2 | 1.0784 |
| Daily Pivot Point S3 | 1.0724 |
| Daily Pivot Point R1 | 1.0954 |
| Daily Pivot Point R2 | 1.1014 |
| Daily Pivot Point R3 | 1.1069 |
More By This Author:
EUR/JPY Price Analysis: Technical Correction Has Further Legs To GoNatural Gas Futures: Rally Could Be Losing Momentum
USD Index Price Analysis: Losses Could Accelerate Below 102.00
Disclosure: Information on this article contains forward-looking statements that involve risks and uncertainties. Markets and instruments profiled on this page are for informational purposes ...
more


