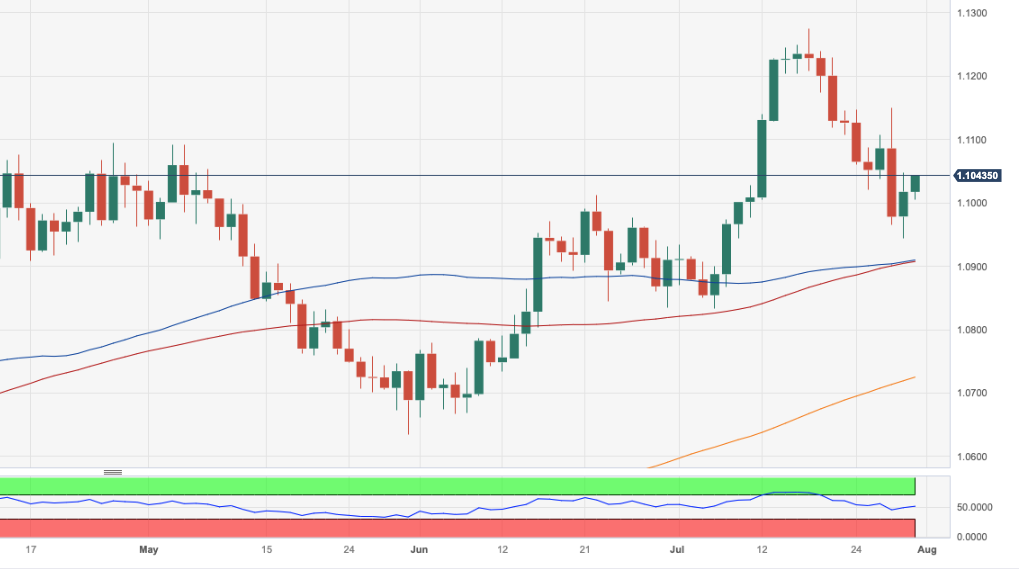
EUR/USD Price Analysis: Immediately To The Upside Comes 1.1150
- EUR/USD looks to add to Friday’s advance north of 1.1000.
- Extra upside faces the next barrier at the weekly top around 1.1150.
EUR/USD climbs further and revisits the 1.1040 region, or daily highs, at the beginning of the week.
In light of the recent price action, the pair could see its selling pressure somewhat mitigated on a breakout of the weekly low of 1.1149 (July 27). Once this level is cleared, spot could the attempt a challenge of the 2023 top at 1.1275 (July 18).
Looking at the longer run, the positive view remains unchanged while above the 200-day SMA, today at 1.0723.
EUR/USD daily chart
(Click on image to enlarge)
EUR/USD
| OVERVIEW | |
|---|---|
| Today last price | 1.1022 |
| Today Daily Change | 40 |
| Today Daily Change % | 0.04 |
| Today daily open | 1.1018 |
| TRENDS | |
|---|---|
| Daily SMA20 | 1.1061 |
| Daily SMA50 | 1.0915 |
| Daily SMA100 | 1.0905 |
| Daily SMA200 | 1.0719 |
| LEVELS | |
|---|---|
| Previous Daily High | 1.1048 |
| Previous Daily Low | 1.0944 |
| Previous Weekly High | 1.115 |
| Previous Weekly Low | 1.0944 |
| Previous Monthly High | 1.1012 |
| Previous Monthly Low | 1.0662 |
| Daily Fibonacci 38.2% | 1.1008 |
| Daily Fibonacci 61.8% | 1.0983 |
| Daily Pivot Point S1 | 1.0958 |
| Daily Pivot Point S2 | 1.0899 |
| Daily Pivot Point S3 | 1.0854 |
| Daily Pivot Point R1 | 1.1062 |
| Daily Pivot Point R2 | 1.1107 |
| Daily Pivot Point R3 | 1.1166 |
More By This Author:
EUR/USD Price Analysis: Not Out Of The Woods YetNatural Gas Futures: Further Retracement On The Cards
EUR/USD Price Analysis: Another Test Of 1.1020 Looks In The Pipeline
Disclosure: Information on this article contains forward-looking statements that involve risks and uncertainties. Markets and instruments profiled on this page are for informational purposes ...
moreComments
Please wait...
Comment posted successfully
No Thumbs up yet!


