
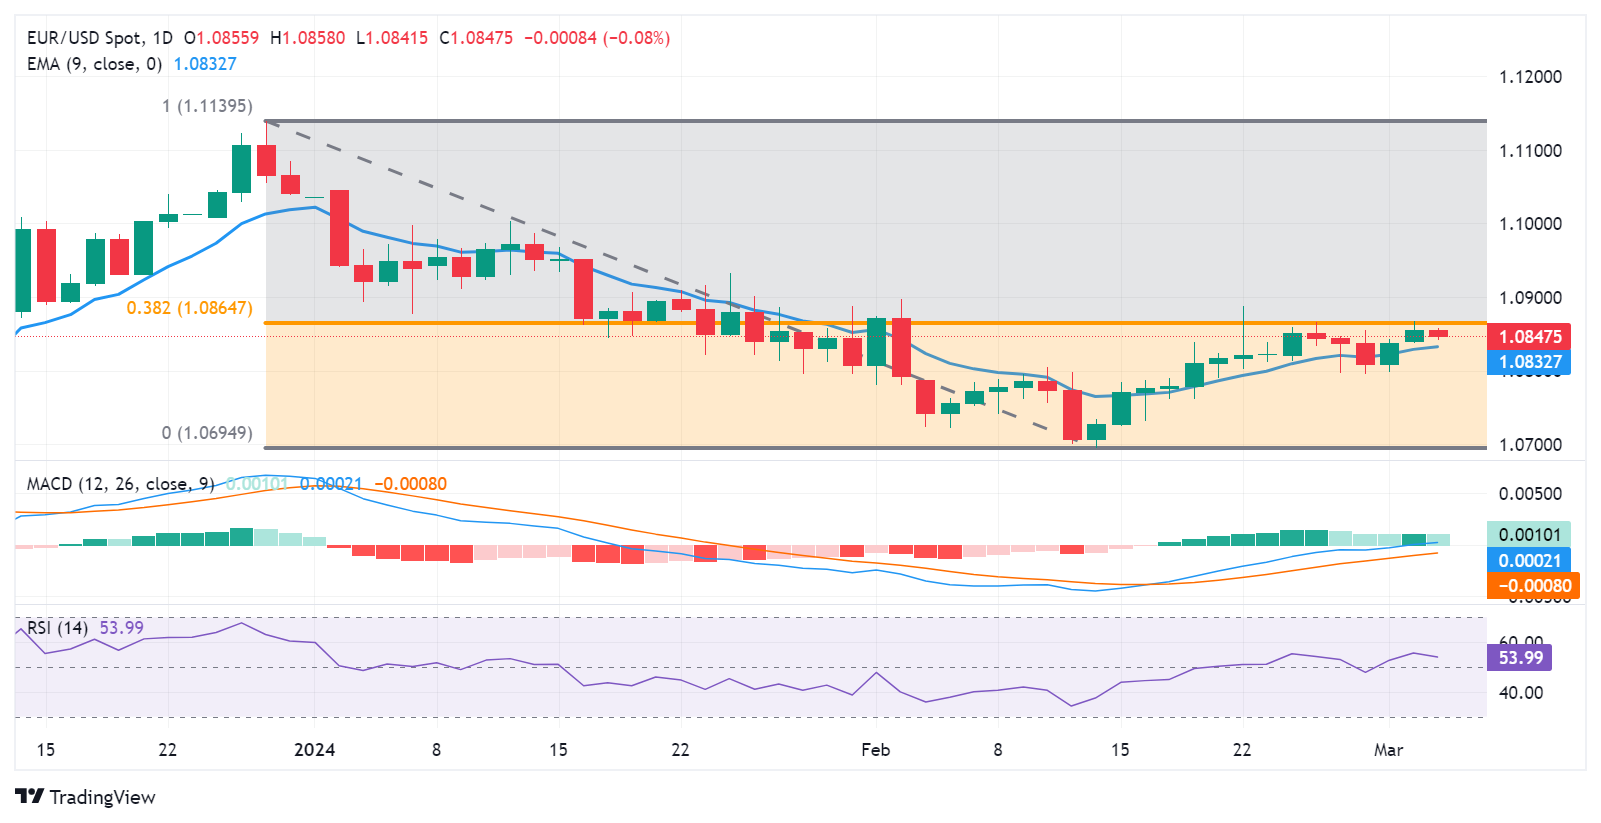
- EUR/USD could find immediate support at the nine-day EMA at 1.0832.
- The technical analysis suggests a confirmation of bullish momentum for the pair.
- The 38.2% Fibonacci retracement of 1.0864 appears to be the key resistance level.
EUR/USD recovered some of its intraday losses but remains in negative territory, hovering around 1.0850 during the European session on Tuesday. The US Dollar (USD) strengthened against the Euro (EUR) on the improved sentiment of risk aversion.
The EUR/USD pair could find immediate support around the nine-day Exponential Moving Average (EMA) at 1.0832. A break below this level could put downward pressure on the pair to test the psychological support at 1.0800 aligned with the previous week’s low at 1.0795. Further support appears at the major level of 1.0750 if the pair surpasses the latter.
Technical analysis indicates a bullish sentiment for the EUR/USD pair. The 14-day Relative Strength Index (RSI) is positioned above the 50 mark. Moreover, the Moving Average Convergence Divergence (MACD) exhibits a divergence above the signal line and lies above the centerline. While a lagging indicator, this suggests a confirmation of the bullish momentum for the EUR/USD pair.
On the upside, the immediate resistance levels for the EUR/USD pair are identified at the 38.2% Fibonacci retracement of 1.0864. A break above this level could exert support for the pair to revisit February’s high at 1.0897, in conjunction with the psychological resistance at 1.0900.
EUR/USD: Daily Chart
(Click on image to enlarge)
EUR/USD
| OVERVIEW | |
|---|---|
| Today last price | 1.0847 |
| Today Daily Change | -0.0009 |
| Today Daily Change % | -0.08 |
| Today daily open | 1.0856 |
| TRENDS | |
|---|---|
| Daily SMA20 | 1.0797 |
| Daily SMA50 | 1.0868 |
| Daily SMA100 | 1.0828 |
| Daily SMA200 | 1.083 |
| LEVELS | |
|---|---|
| Previous Daily High | 1.0867 |
| Previous Daily Low | 1.0838 |
| Previous Weekly High | 1.0866 |
| Previous Weekly Low | 1.0796 |
| Previous Monthly High | 1.0898 |
| Previous Monthly Low | 1.0695 |
| Daily Fibonacci 38.2% | 1.0856 |
| Daily Fibonacci 61.8% | 1.0849 |
| Daily Pivot Point S1 | 1.084 |
| Daily Pivot Point S2 | 1.0824 |
| Daily Pivot Point S3 | 1.0811 |
| Daily Pivot Point R1 | 1.0869 |
| Daily Pivot Point R2 | 1.0883 |
| Daily Pivot Point R3 | 1.0899 |
More By This Author:
USD/CAD Depreciates To Near 1.3560 On Higher Crude Oil Prices, US Manufacturing PMI EyedUSD/CAD Continues Its Winning Streak On Lower Crude Oil Prices, Improves To Near 1.3580


Comments
Log in or sign up to join the conversation.