EUR/USD Price Analysis - Gains Remain Capped By 1.0800
Image Source: Unsplash
- EUR/USD advances to new multi-week highs around 1.0790.
- There is a tough barrier at the 1.0800 zone so far.
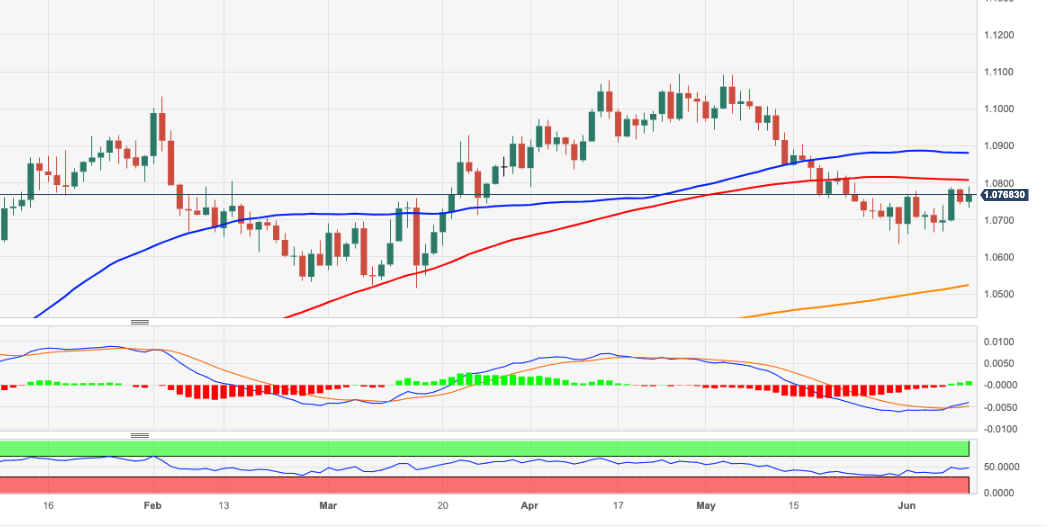
EUR/USD resumes the upside bias following Friday’s marked pullback and approaches the 1.0800 region.
A more serious bullish attempt is expected to quickly surpass the so far monthly high at 1.0790 (June 12), which is closely followed by the round level at 1.0800. The latter, in turn, appears propped up by the temporary 100-day SMA at 1.0805.
Looking at the longer run, the constructive view remains unchanged while above the 200-day SMA, today at 1.0522.
EUR/USD daily chart
(Click on image to enlarge)
EUR/USD
| OVERVIEW | |
|---|---|
| Today last price | 1.0764 |
| Today Daily Change | 46 |
| Today Daily Change % | 0.14 |
| Today daily open | 1.0749 |
| TRENDS | |
|---|---|
| Daily SMA20 | 1.0759 |
| Daily SMA50 | 1.0885 |
| Daily SMA100 | 1.0808 |
| Daily SMA200 | 1.052 |
| LEVELS | |
|---|---|
| Previous Daily High | 1.0785 |
| Previous Daily Low | 1.0743 |
| Previous Weekly High | 1.0787 |
| Previous Weekly Low | 1.0667 |
| Previous Monthly High | 1.1092 |
| Previous Monthly Low | 1.0635 |
| Daily Fibonacci 38.2% | 1.0759 |
| Daily Fibonacci 61.8% | 1.0769 |
| Daily Pivot Point S1 | 1.0733 |
| Daily Pivot Point S2 | 1.0717 |
| Daily Pivot Point S3 | 1.069 |
| Daily Pivot Point R1 | 1.0775 |
| Daily Pivot Point R2 | 1.0801 |
| Daily Pivot Point R3 | 1.0817 |
More By This Author:
USD Index Price Analysis: Immediately To The Downside Comes 103.00Natural Gas: A Near-Term Rebound Looks Probable
Natural Gas Futures: Extra Gains Appear Limited
Disclosure: Information on this article contains forward-looking statements that involve risks and uncertainties. Markets and instruments profiled on this page are for informational purposes ...
more


