EUR/USD Price Analysis: Further Losses Likely Below 1.0912
Image Source: Unsplash
- EUR/USD’s downside picks up further traction on Tuesday.
- A more sustained decline is expected once 1.0912 is cleared.
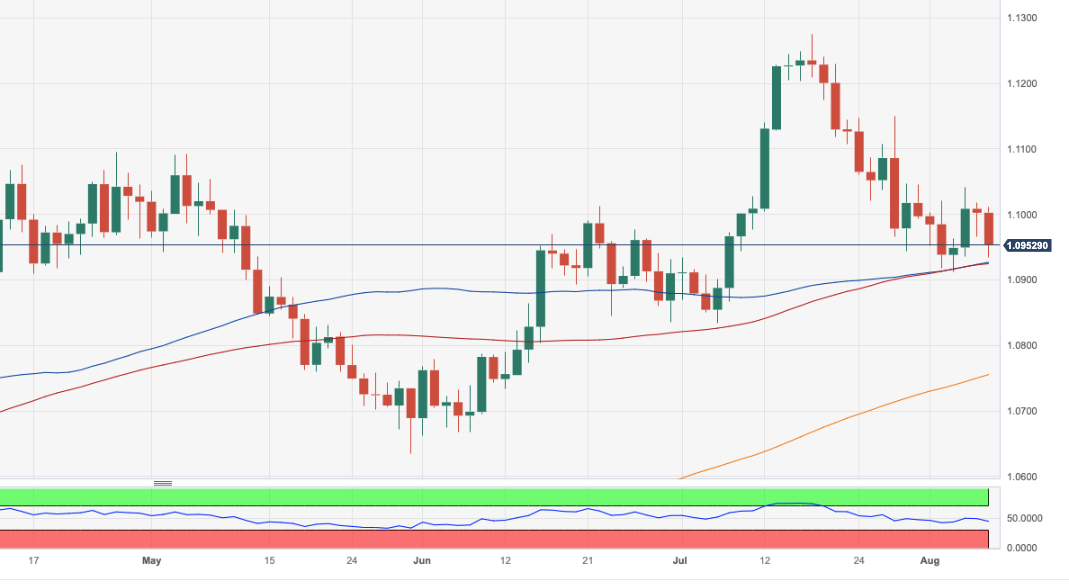
EUR/USD extends the downward bias to new weekly lows near 1.0930 on Tuesday.
In case losses accelerate, spot should face interim contention at the 55-day and 100-day SMAs at 1.0925 and 1.0923, respectively, prior to the so-far August low at 1.0912 (August 3). Once the latter is breached on a convincing fashion, the pair could embark on a move to the July low of 1.0833 (July 6).
In the meantime, while below the weekly high of 1.1149 (July 27), the pair risks further retracements for the time being.
Looking at the longer run, the positive view remains unchanged while above the 200-day SMA, today at 1.0748.
EUR/USD daily chart
(Click on image to enlarge)
EUR/USD
| OVERVIEW | |
|---|---|
| Today last price | 1.0951 |
| Today Daily Change | 77 |
| Today Daily Change % | -0.46 |
| Today daily open | 1.1002 |
| TRENDS | |
|---|---|
| Daily SMA20 | 1.108 |
| Daily SMA50 | 1.0942 |
| Daily SMA100 | 1.0923 |
| Daily SMA200 | 1.075 |
| LEVELS | |
|---|---|
| Previous Daily High | 1.1018 |
| Previous Daily Low | 1.0966 |
| Previous Weekly High | 1.1046 |
| Previous Weekly Low | 1.0912 |
| Previous Monthly High | 1.1276 |
| Previous Monthly Low | 1.0834 |
| Daily Fibonacci 38.2% | 1.0986 |
| Daily Fibonacci 61.8% | 1.0998 |
| Daily Pivot Point S1 | 1.0973 |
| Daily Pivot Point S2 | 1.0943 |
| Daily Pivot Point S3 | 1.092 |
| Daily Pivot Point R1 | 1.1025 |
| Daily Pivot Point R2 | 1.1048 |
| Daily Pivot Point R3 | 1.1078 |
More By This Author:
USD Index Keeps The Bid Bias Above 102.00 So FarUSD Index Price Analysis: Immediate Hurdle Comes At 102.84
USD Index Resumes The Uptrend And Regains 102.30
Disclosure: Information on this article contains forward-looking statements that involve risks and uncertainties. Markets and instruments profiled on this page are for informational purposes ...
more


