
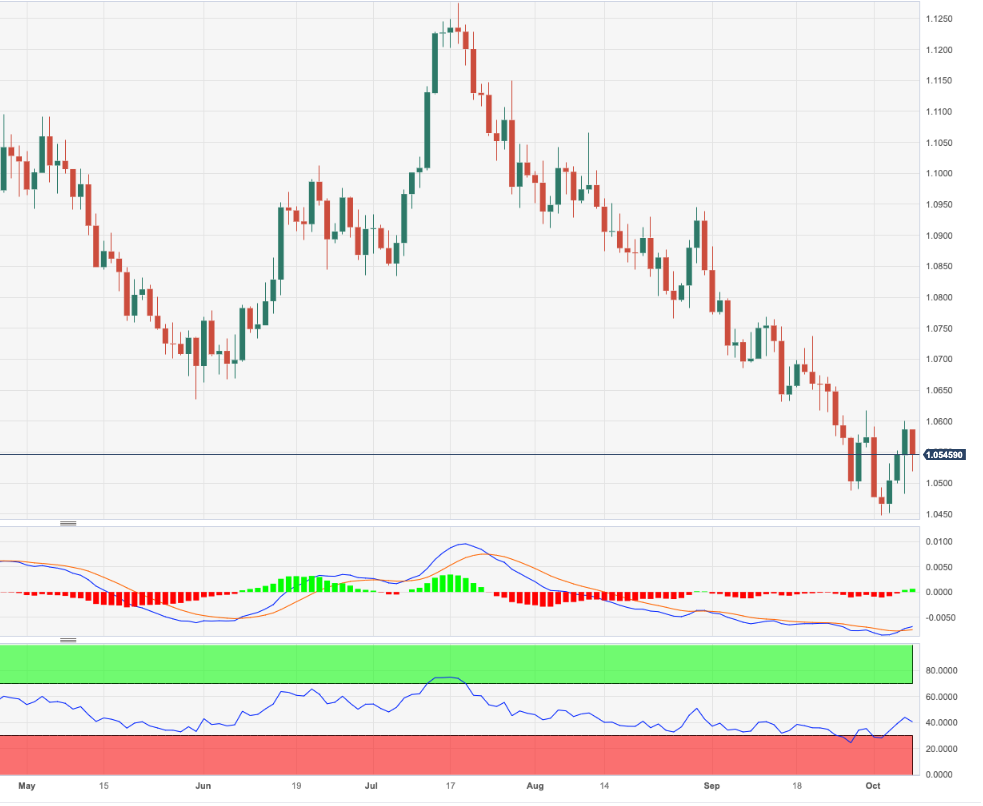
- EUR/USD comes under pressure following Friday’s tops.
- Extra weakness could prompt the pair to drop to 1.0450.
EUR/USD revisits the 1.0520 region following renewed downside pressure and following Friday’s climb to as high as the 1.0600 region.
In case bulls regain the initiative, the pair should initially retarget the minor barrier at 1.0617 (September 29) ahead of the weekly peak of 1.0767 (September 12). On the flip side, if bears regain the upper hand, the pair could slip back to the area of yearly lows around 1.0450 (October 3).
Meanwhile, further losses remain on the table as long as the pair navigates the area below the key 200-day SMA, today at 1.0823.
EUR/USD daily chart
(Click on image to enlarge)
EUR/USD
| OVERVIEW | |
|---|---|
| Today last price | 1.0547 |
| Today Daily Change | 55 |
| Today Daily Change % | -0.38 |
| Today daily open | 1.0587 |
| TRENDS | |
|---|---|
| Daily SMA20 | 1.0613 |
| Daily SMA50 | 1.0771 |
| Daily SMA100 | 1.0843 |
| Daily SMA200 | 1.0825 |
| LEVELS | |
|---|---|
| Previous Daily High | 1.06 |
| Previous Daily Low | 1.0482 |
| Previous Weekly High | 1.06 |
| Previous Weekly Low | 1.0448 |
| Previous Monthly High | 1.0882 |
| Previous Monthly Low | 1.0488 |
| Daily Fibonacci 38.2% | 1.0555 |
| Daily Fibonacci 61.8% | 1.0527 |
| Daily Pivot Point S1 | 1.0513 |
| Daily Pivot Point S2 | 1.0439 |
| Daily Pivot Point S3 | 1.0395 |
| Daily Pivot Point R1 | 1.063 |
| Daily Pivot Point R2 | 1.0674 |
| Daily Pivot Point R3 | 1.0748 |
More By This Author:
Natural Gas Futures: A Pause In The Rally Looks LikelyUSD Index Price Analysis: Next On The Upside Comes The 2023 Peak
Natural Gas Futures: Bullish Momentum Remains In Store


Comments
Log in or sign up to join the conversation.