

Image Source: Pixabay
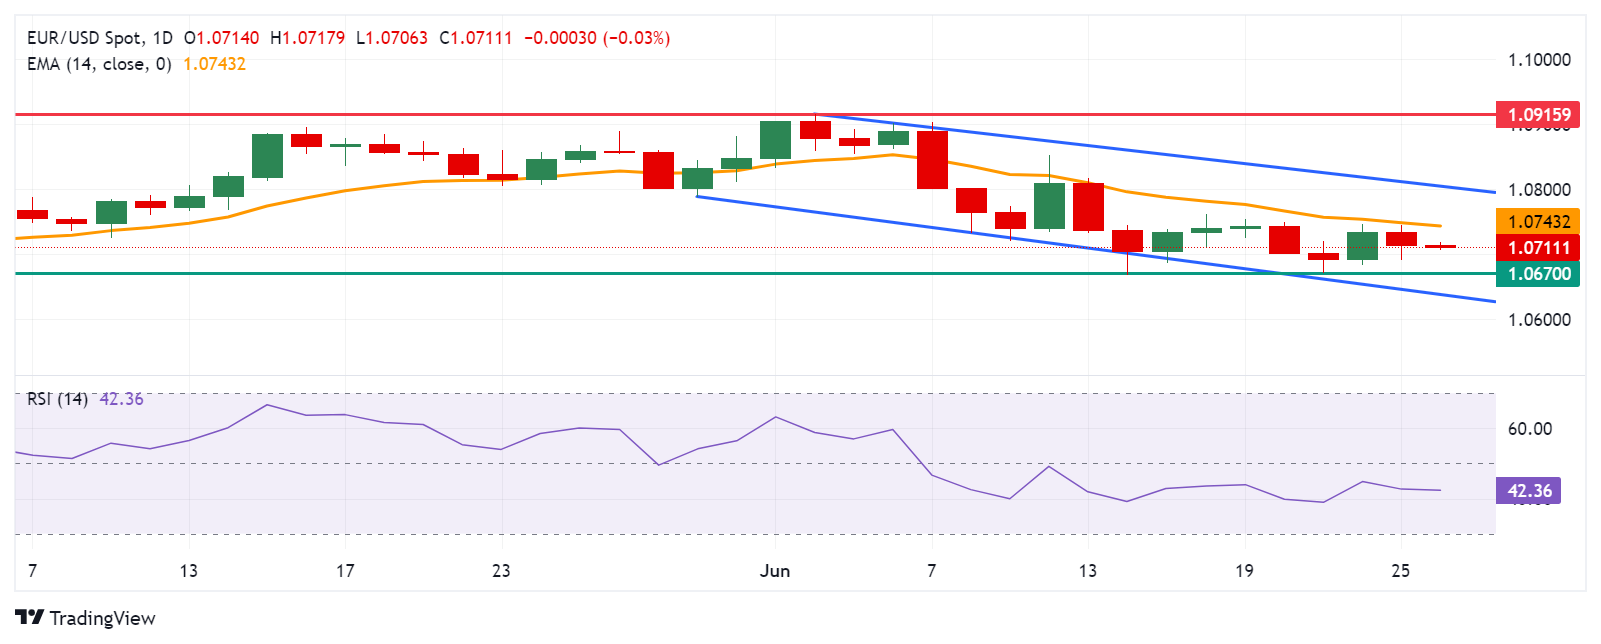
- The EUR/USD pair could test a throwback support at the 1.0670 level.
- The daily chart suggests a bearish bias as the pair consolidates within the descending channel.
- The immediate resistance appears at the 14-day EMA at the level of 1.0743.
EUR/USD extends its losses for the second consecutive day, trading around 1.0710 during the Asian session on Wednesday. A technical analysis of a daily chart suggests a bearish bias for the pair, as it consolidates within the descending channel.
Additionally, the momentum indicator 14-day Relative Strength Index (RSI) is positioned below the 50 level, suggesting a confirmation of a bearish bias for the EUR/USD pair.
The EUR/USD pair could find immediate support at the psychological level of 1.0700. A break below this level could exert downward pressure on the pair to test the throwback support at the level of 1.0670.
Further decline would strengthen the bearish bias and the pair could navigate the region around the lower boundary of the descending channel near the 1.0640 level.
On the upside, the EUR/USD pair could meet the immediate barrier at the 14-day Exponential Moving Average (EMA) at the level of 1.0743. A breakthrough above this level could lead the pair to test the area around the psychological level of 1.0800 and the upper boundary of the descending channel nearing the level of 1.0810.
Further resistance appears at the vicinity of the significant level of 1.0900 and a three-month high at 1.0915, which was recorded on June 4.
EUR/USD: Daily Chart
EUR/USD
| OVERVIEW | |
|---|---|
| Today last price | 1.071 |
| Today Daily Change | -0.0004 |
| Today Daily Change % | -0.04 |
| Today daily open | 1.0714 |
| TRENDS | |
|---|---|
| Daily SMA20 | 1.0782 |
| Daily SMA50 | 1.0773 |
| Daily SMA100 | 1.0795 |
| Daily SMA200 | 1.079 |
| LEVELS | |
|---|---|
| Previous Daily High | 1.0744 |
| Previous Daily Low | 1.0691 |
| Previous Weekly High | 1.0762 |
| Previous Weekly Low | 1.0671 |
| Previous Monthly High | 1.0895 |
| Previous Monthly Low | 1.065 |
| Daily Fibonacci 38.2% | 1.0711 |
| Daily Fibonacci 61.8% | 1.0724 |
| Daily Pivot Point S1 | 1.0688 |
| Daily Pivot Point S2 | 1.0663 |
| Daily Pivot Point S3 | 1.0635 |
| Daily Pivot Point R1 | 1.0742 |
| Daily Pivot Point R2 | 1.077 |
| Daily Pivot Point R3 | 1.0795 |
More By This Author:
USD/CAD Depreciates To Near 1.3650 Ahead Of Canada’s CPIAustralian Dollar Recovers Losses Amid Improved Consumer Sentiment Index
USD/CAD Appreciates To Near 1.3700 As Fed Delays The Expected Timing Of The Rate Cut


Comments
Log in or sign up to join the conversation.