
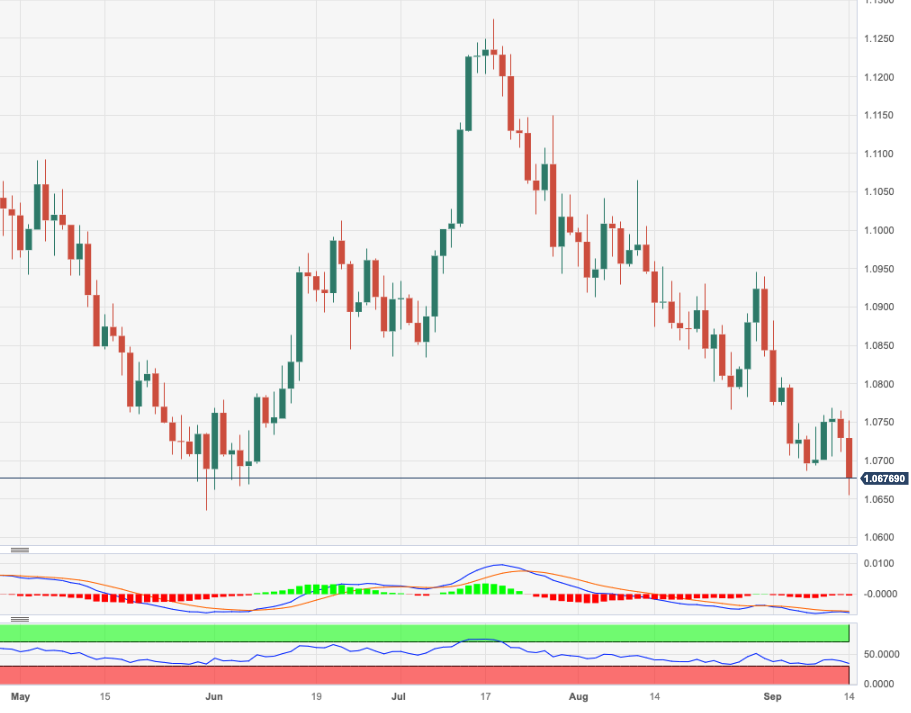
- EUR/USD intensify its decline to fresh four-month lows.
- Bears now re-shift their attention to the 1.0630 zone.
EUR/USD sinks to levels last traded four months ago in the mid-1.0600s on Thursday.
The underlying bearish sentiment remains unchanged and leaves the door open to extra pullbacks in the short-term horizon. Against that backdrop, a sustained breach of the 1.0700 yardstick could encourage sellers to embark on a probable visit to the May low of 1.0635 (May 31).
In the meantime, further losses remain in the pipeline while below the key 200-day SMA, today at 1.0827.
EUR/USD daily chart
(Click on image to enlarge)
EUR/USD
| OVERVIEW | |
|---|---|
| Today last price | 1.0668 |
| Today Daily Change | 98 |
| Today Daily Change % | -0.57 |
| Today daily open | 1.0729 |
| TRENDS | |
|---|---|
| Daily SMA20 | 1.0804 |
| Daily SMA50 | 1.0941 |
| Daily SMA100 | 1.0902 |
| Daily SMA200 | 1.0827 |
| LEVELS | |
|---|---|
| Previous Daily High | 1.0765 |
| Previous Daily Low | 1.0711 |
| Previous Weekly High | 1.0809 |
| Previous Weekly Low | 1.0686 |
| Previous Monthly High | 1.1065 |
| Previous Monthly Low | 1.0766 |
| Daily Fibonacci 38.2% | 1.0732 |
| Daily Fibonacci 61.8% | 1.0744 |
| Daily Pivot Point S1 | 1.0705 |
| Daily Pivot Point S2 | 1.0681 |
| Daily Pivot Point S3 | 1.0652 |
| Daily Pivot Point R1 | 1.0759 |
| Daily Pivot Point R2 | 1.0789 |
| Daily Pivot Point R3 | 1.0813 |
More By This Author:
EUR/JPY Price Analysis: Further Range Bound Looks LikelyCrude Oil Futures: Rally Could Take A Breather
EUR/USD Price Analysis: Upside Remains Limited By 1.0770


Comments
Log in or sign up to join the conversation.