
- EUR/USD adds to the ongoing bearish move and drops below 1.0700.
- Extra decline appears in the pipeline below the 1.0770 region.
EUR/USD remains well on the defensive and drops to new lows in the sub-1.0700 zone on Tuesday.
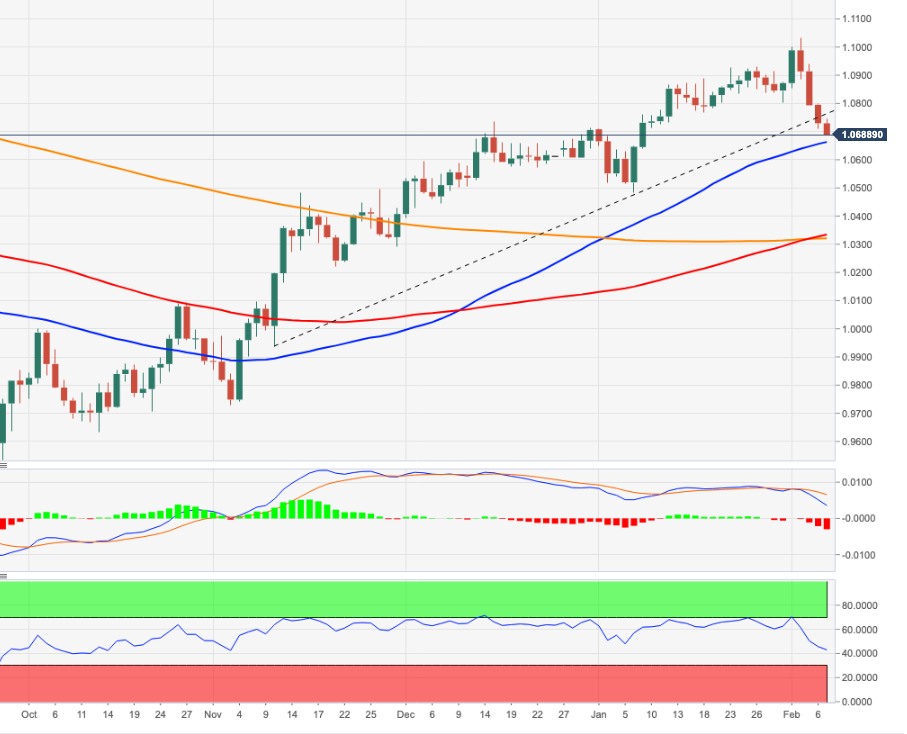
The pair has recently broken below the 3-month support line near 1.0770, and this now allows for the downtrend to gather extra impulse in the near term. Against that, the next interim support comes at the 55-day SMA at 1.0662, while the breach of this region could open the door to a deeper retracement to the 2023 low at 1.0481 (January 6).
In the longer run, the constructive view remains unchanged while above the 200-day SMA, today at 1.0319.
EUR/USD daily chart
(Click on image to enlarge)
EUR/USD
| OVERVIEW | |
|---|---|
| Today last price | 1.07 |
| Today Daily Change | 55 |
| Today Daily Change % | -0.28 |
| Today daily open | 1.073 |
| TRENDS | |
|---|---|
| Daily SMA20 | 1.0841 |
| Daily SMA50 | 1.0685 |
| Daily SMA100 | 1.0327 |
| Daily SMA200 | 1.032 |
| LEVELS | |
|---|---|
| Previous Daily High | 1.0799 |
| Previous Daily Low | 1.071 |
| Previous Weekly High | 1.1033 |
| Previous Weekly Low | 1.0793 |
| Previous Monthly High | 1.093 |
| Previous Monthly Low | 1.0483 |
| Daily Fibonacci 38.2% | 1.0744 |
| Daily Fibonacci 61.8% | 1.0765 |
| Daily Pivot Point S1 | 1.0693 |
| Daily Pivot Point S2 | 1.0657 |
| Daily Pivot Point S3 | 1.0604 |
| Daily Pivot Point R1 | 1.0782 |
| Daily Pivot Point R2 | 1.0835 |
| Daily Pivot Point R3 | 1.0872 |
More By This Author:
USD Index Price Analysis: Recovery Looks Firm Near TermNatural Gas Futures: Technical Rebound In The Offing?
EUR/JPY Price Analysis: The 200-Day SMA Holds The Downside So Far


Comments
Log in or sign up to join the conversation.