
- EUR/USD sharply reverses part of the recent three-day advance.
- Next on the downside comes the 200-day SMA (1.0812).
EUR/USD faces strong headwinds and slips back to the 1.0860 zone on Thursday following tops near 1.0950 recorded in the previous session.
Despite the daily knee-jerk, the pair’s current momentum seems to be favoring the continuation of the march north for the time being. That said, there is a temporary hurdle at the 55-day SMA at 1.0968, which precedes the psychological 1.1000 mark and the August top of 1.1064 (August 10).
In case losses gather extra impulse, a pullback to the 200-day SMA, today at 1.0812, should not be ruled out.
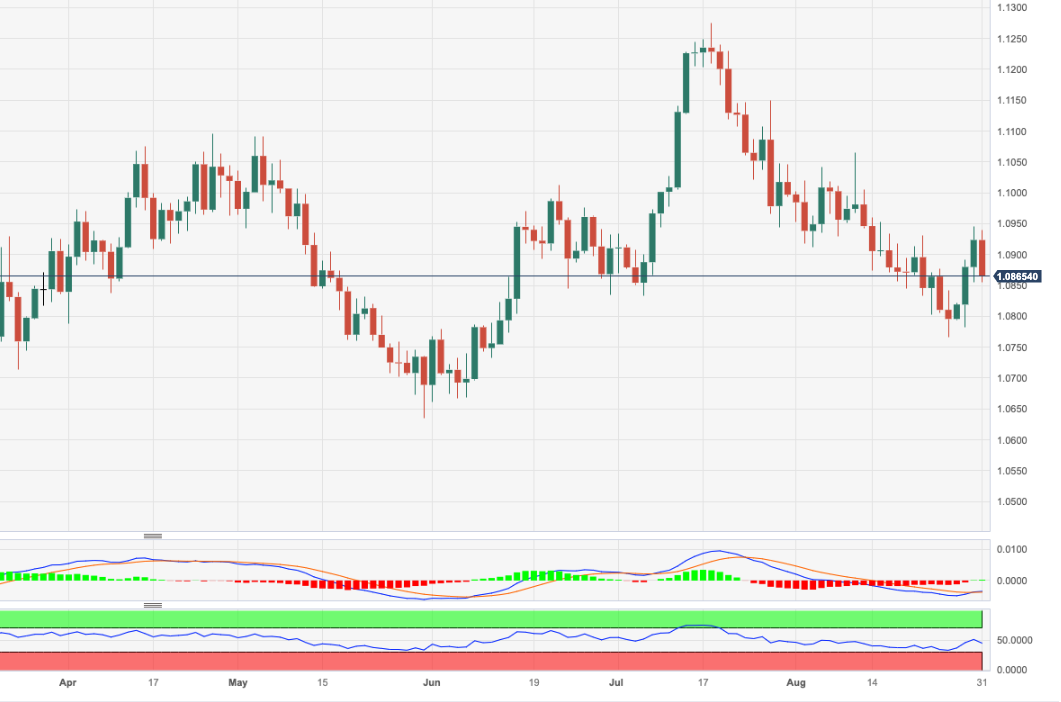
In the meantime, the pair is likely to keep the bullish outlook unchanged while above the 200-day SMA.
EUR/USD daily chart
(Click on image to enlarge)
EUR/USD
| OVERVIEW | |
|---|---|
| Today last price | 1.0861 |
| Today Daily Change | 85 |
| Today Daily Change % | -0.58 |
| Today daily open | 1.0924 |
| TRENDS | |
|---|---|
| Daily SMA20 | 1.0904 |
| Daily SMA50 | 1.0973 |
| Daily SMA100 | 1.0926 |
| Daily SMA200 | 1.0812 |
| LEVELS | |
|---|---|
| Previous Daily High | 1.0946 |
| Previous Daily Low | 1.0855 |
| Previous Weekly High | 1.093 |
| Previous Weekly Low | 1.0766 |
| Previous Monthly High | 1.1276 |
| Previous Monthly Low | 1.0834 |
| Daily Fibonacci 38.2% | 1.0911 |
| Daily Fibonacci 61.8% | 1.089 |
| Daily Pivot Point S1 | 1.0871 |
| Daily Pivot Point S2 | 1.0818 |
| Daily Pivot Point S3 | 1.078 |
| Daily Pivot Point R1 | 1.0961 |
| Daily Pivot Point R2 | 1.0998 |
| Daily Pivot Point R3 | 1.1051 |
More By This Author:
Natural Gas Futures: Corrective Move In The PipelineEUR/USD Price Analysis: Extra Upside Now Targets 1.0970
EUR/JPY Price Analysis: Next Stop At The 160.00 Mark


Comments
Log in or sign up to join the conversation.