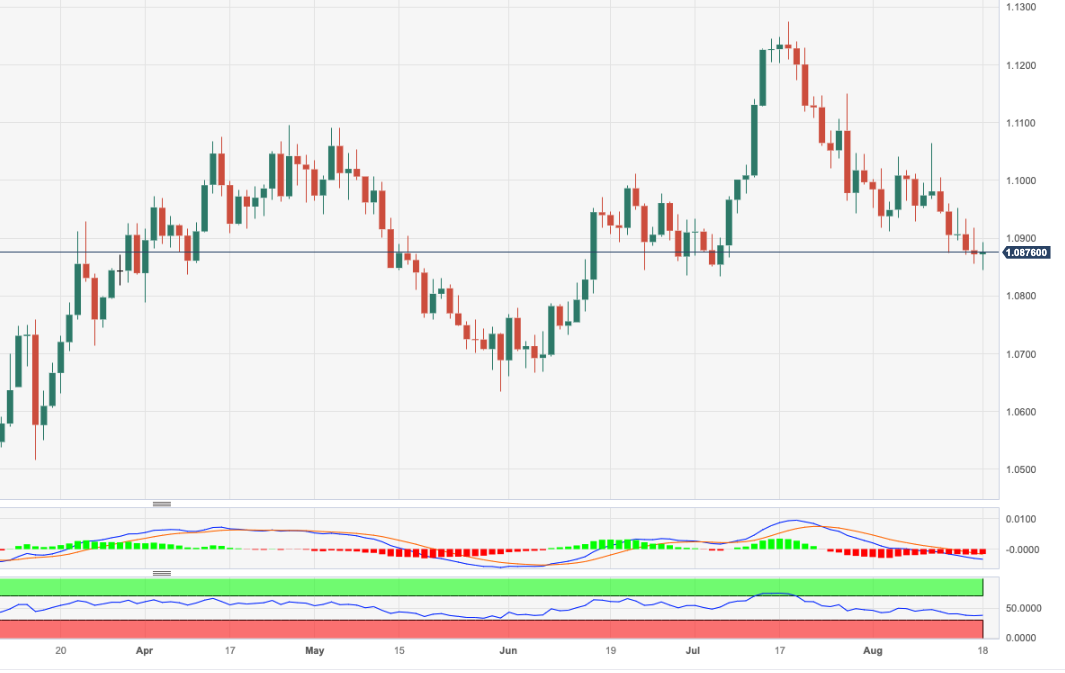
EUR/USD Price Analysis: A Drop To 1.0833 Remains In Store
- EUR/USD prints new lows near 1.0840 on Friday.
- Further weakness could revisit the 1.0830 region.
EUR/USD maintains the multi-session bearish move well in place at the end of the week.
A deeper pullback now targets the July low of 1.0833 (July 6). The loss of this region leaves the pair vulnerable to a probable test of the critical 200-day SMA at 1.0790 in the short-term horizon.
In the meantime, the pair’s positive outlook remains unchanged while above the 200-day SMA.
EUR/USD daily chart
(Click on image to enlarge)
EUR/USD
| OVERVIEW | |
|---|---|
| Today last price | 1.0864 |
| Today Daily Change | 49 |
| Today Daily Change % | -0.07 |
| Today daily open | 1.0872 |
| TRENDS | |
|---|---|
| Daily SMA20 | 1.0981 |
| Daily SMA50 | 1.0975 |
| Daily SMA100 | 1.0931 |
| Daily SMA200 | 1.0789 |
| LEVELS | |
|---|---|
| Previous Daily High | 1.0918 |
| Previous Daily Low | 1.0856 |
| Previous Weekly High | 1.1065 |
| Previous Weekly Low | 1.0929 |
| Previous Monthly High | 1.1276 |
| Previous Monthly Low | 1.0834 |
| Daily Fibonacci 38.2% | 1.088 |
| Daily Fibonacci 61.8% | 1.0895 |
| Daily Pivot Point S1 | 1.0846 |
| Daily Pivot Point S2 | 1.0821 |
| Daily Pivot Point S3 | 1.0785 |
| Daily Pivot Point R1 | 1.0908 |
| Daily Pivot Point R2 | 1.0944 |
| Daily Pivot Point R3 | 1.097 |
More By This Author:
Natural Gas Futures: Further Decline On The CardsEUR/USD Price Analysis: Interim resistance emerges at 1.0950
Natural Gas Futures: Near-Term Rebound In The Offing
Disclosure: Information on this article contains forward-looking statements that involve risks and uncertainties. Markets and instruments profiled on this page are for informational purposes ...
moreComments
Please wait...
Comment posted successfully
No Thumbs up yet!


