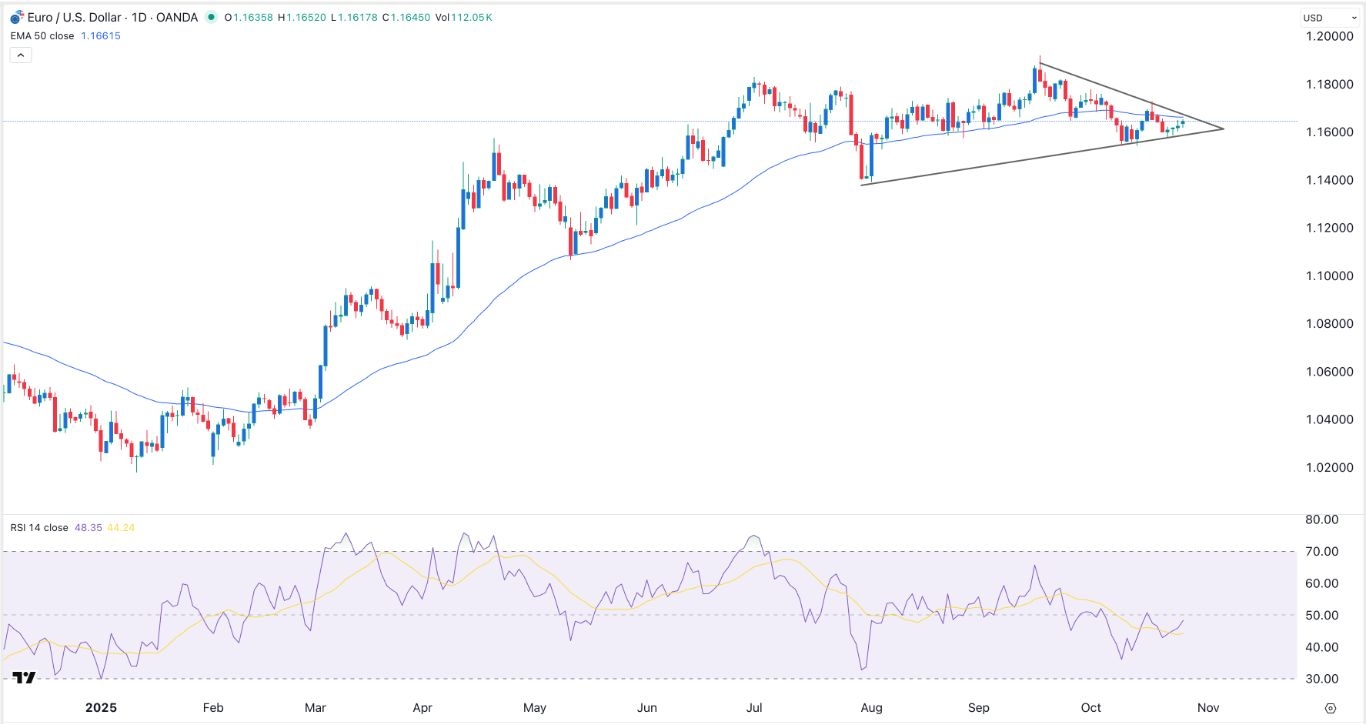
EUR/USD Forex Signal: Triangle Pattern Points To A Strong Breakout
Bullish view
- Buy the EUR/USD pair and set a take-profit at 1.1750.
- Add a stop-loss at 1.1550.
- Timeline: 1-2 days.
Bearish view
- Sell the EUR/USD pair and set a take-profit at 1.1550.
- Add a stop-loss at 1.1750.
(Click on image to enlarge)

The EUR/USD exchange rate remained in a tight range on Tuesday as traders positioned themselves for the upcoming Federal Reserve and European Central Bank (ECB) interest rate decisions. It was trading at 1.1647, inside a range it has been in the past few days.
Fed and ECB Interest Rate Decisions
The EUR/USD pair has been in a tight range in the past few days, but this could change in the coming days as traders react to some major macro events from the US and Europe.
The first major data to watch will be the upcoming US consumer confidence report by the Conference Board. This report will provide more information about the health of the consumer as the government shutdown continues.
Economists expect the report to show that consumer confidence retreated from 94.2 in September to 93.4 this month, as fears about the labor market and inflation remain.
The other key EUR/USD news will be the upcoming Federal Reserve interest rate decision on Wednesday. Based on the recent economic numbers, there are chances that the Fed will cut rates and end or slow its quantitative tightening policies.
The EUR/USD pair will next react to the upcoming European GDP report, which will provide more color on the health of the bloc’s economy during Donald Trump's tariffs era. Economists expect the data to show that the economy grew by 1.2% in Q2 from 1.5%. A PMI result released last week showed that business activity increased to the highest point since June last year.
The GDP data will come a few hours before the European Central Bank (ECB) delivers its interest rate decision. With inflation hovering at 2%, analysts expect the bank to leave interest rates unchanged at 2%.
EUR/USD Technical Analysis
The daily timeframe chart shows that the EUR/USD pair has remained in a tight range in the past few days. It is oscillating at the 50-day and 25-day Exponential Moving Averages.
Most notably, the pair has formed a symmetrical triangle pattern and the two lines are nearing their confluence. This pattern points to a potential breakout in either direction. The key support and resistance levels to watch will be at 1.1530 and 1.1750.
More By This Author:
Top 3 Dow Jones Index And DIA ETF Stocks To Watch This WeekAUD/USD Forex Signal: Megaphone Forms Ahead Of Australia CPI, Fed Decision
Top Catalysts For The Nasdaq 100 Index And ETFs Like JEPQ, QQQ, And QYLD
Risk Disclaimer: DailyForex will not be held liable for any loss or damage resulting from reliance on the information contained within this website including market news, analysis, trading signals ...
more


