EUR/USD Forex Signal: Set To Hit YTD High Ahead Of Key Events
Bullish view
- Buy the EUR/USD pair and set a take-profit at 1.1900.
- Add a stop-loss at 1.1600.
- Timeline: 1-2 days.
Bearish view
- Sell the EUR/USD pair and set a take-profit at 1.1600.
- Add a stop-loss at 1.1900.
(Click on image to enlarge)
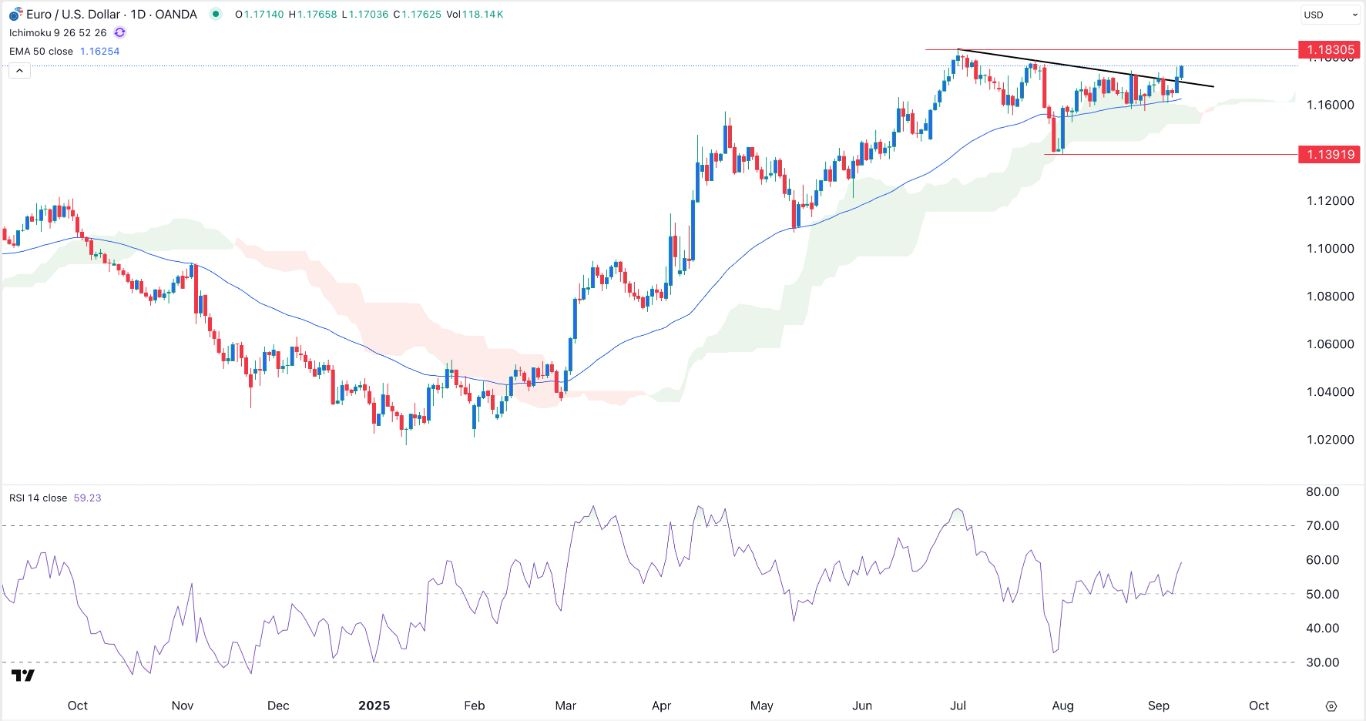
The EUR/USD exchange rate rose to 1.1760, its highest level since July 24 as traders waited for key events from the United States and the upcoming European Central Bank (ECB) interest rate decision. It has jumped by 3.28% from the lowest level in July.
US Jobs Data and Inflation and ECB Interest Rate Decision
The EUR/USD exchange rate has been in a strong bullish trend as hopes that the Federal Reserve will cut interest rates in the coming meeting next week.
Hopes of this cut rose on Friday after the Bureau of Labor Statistics published its nonfarm payrolls data. The report showed that the economy created just 22,000 jobs in August as the unemployment rate rose to 4.3%.
The bureau will publish the latest revisions for the number of jobs created in the 12 months through March last year. Some analysts expect the revision to show that the economy added 800k fewer jobs than previously reported. The previous revision showed that the economy added 818k fewer jobs.
The EUR/USD exchange rate will then react to the upcoming US consumer and producer inflation data. Economists expect the upcoming data to show that the headline CPI rose from 2.7% in July to 2.9% in August, while the core CPI moved to 3.2%.
The pair will also react to the upcoming European Central Bank (ECB) interest rate decision. Economists expect the central bank to maintain interest rates unchanged.
The other notable catalyst for the pair will be the political crisis in France, where Francois Bayrou lost a vote of no confidence vote, leading to the collapse of the government.
EUR/USD Technical Analysis
The daily timeframe chart shows that the EUR/USD exchange rate bottomed at 1.1390, its lowest level in July. It has now moved above the 50-day Exponential Moving Average (EMA).
The pair has moved above the Ichimoku cloud indicator and the descending trendline that connects the highest swings since July 1. This trendline is the neckline of the inverse head-and-shoulders pattern, a popular bullish reversal sign.
Therefore, the most likely outlook is bullish, with the initial target being the year-to-date high of 1.1830 followed by the psychological point at 1.1900. A drop below the 50-day moving average at 1.625 will invalidate the bullish outlook.
More By This Author:
Synopsys Stock Price Bullish Flag Points To A Surge After EarningsBTC/USD Forex Signal: Bitcoin Pressured Despite ETF Inflows
USD/TRY Forecast Ahead Of The CBRT Decision, U.S. Inflation Data
Risk Disclaimer: DailyForex will not be held liable for any loss or damage resulting from reliance on the information contained within this website including market news, analysis, trading signals ...
more


