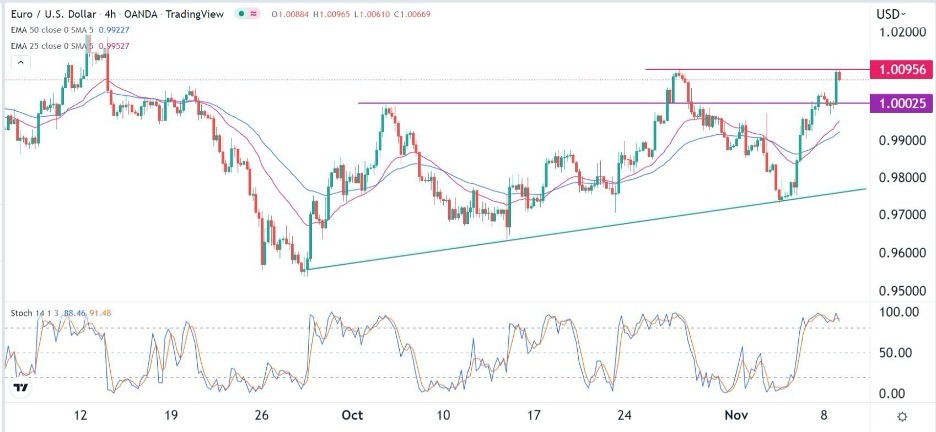
EUR/USD Forex Signal: Double-Top Pattern Forms
Bearish view
- Sell the EUR/USD pair and set a take-profit at 1.000.
- Add a stop-loss at 1.0095.
- Timeline: 1-2 days.
Bullish view
- Buy the EUR/USD pair and set a take-profit at 1.0200.
- Add a stop-loss at 0.9900.
The EUR/USD price rose for three straight days as the US dollar continued. It rose to a high of 1.0095 as investors focused on the American mid-term election. The pair has jumped by more than 5.6% from its lowest level in October.
US mid-term elections
US voters headed to the polls on Tuesday to elect their Washington representatives. The closely watched event will determine the balance of power in the country in the next two years.
Preliminary results at the time of writing showed that Republicans were moving towards victory in the lower house. It is a bit early to determine who will lead the Senate.
Historically, the party in power tends to lose the majority in Congress during the mid-term elections. This situation was made worse by Joe Biden’s poor approval ratings. In most periods, American stocks tend to do well after midterms because of the deadlock that emerges.
The EUR/USD pair will continue reacting to results as they stream in. Bond yields declined, with the 10-year and 30-year falling to 4.14% and 4.27%, respectively. Stocks also continued rising while the US dollar index slipped by more than 50 basis points.
There will be no major economic data from the US and Europe on Wednesday. Therefore, traders will focus on the upcoming American inflation data scheduled for Thursday this week. Economists expect the data to show that inflation remained at an elevated level in October.
Precisely, economists polled by Reuters expect the data to show that the headline CPI rose from 0.4% in September to 0.6% in October. They expect that the core CPI dropped slightly from 0.6% to 0.5%. On a YoY basis, the two are expected to come in at 8.0% and 6.5%, respectively.
EUR/USD forecast
The EUR/USD has been in a strong bullish trend in the past few days. It has managed to rise from a low of 0.9731 on November 3 to 1.0095. On the four-hour chart, the pair has formed a double-top pattern, whose neckline is at 0.9726. It has moved slightly above the 25-day and 50-day moving averages.
The Stochastic Oscillator has moved above the overbought level. Therefore, there is a possibility that the pair will have a bearish breakout in the coming days. If this happens, the next key level to watch will be at parity.
(Click on image to enlarge)

More By This Author:
AUD/USD Forex Signal: Extremely Bullish Above 0.6520EUR/USD Technical Analysis: Breakout In The Parity Rate
GBP/USD Technical Analysis: When Is It Possible To Sell?
Disclosure: DailyForex will not be held liable for any loss or damage resulting from reliance on the information contained within this website including market news, analysis, trading signals ...
more


