EUR/USD Forex Signal: Bearish Trend To Continue For A While
Bearish view
- Sell the EUR/USD pair and set a take-profit at 1.0700.
- Add a stop-loss at 1.0950.
- Timeline: 1-2 days.
Bullish view
- Buy the EUR/USD pair and set a take-profit at 1.0950.
- Add a stop-loss at 1.0700.
(Click on image to enlarge)
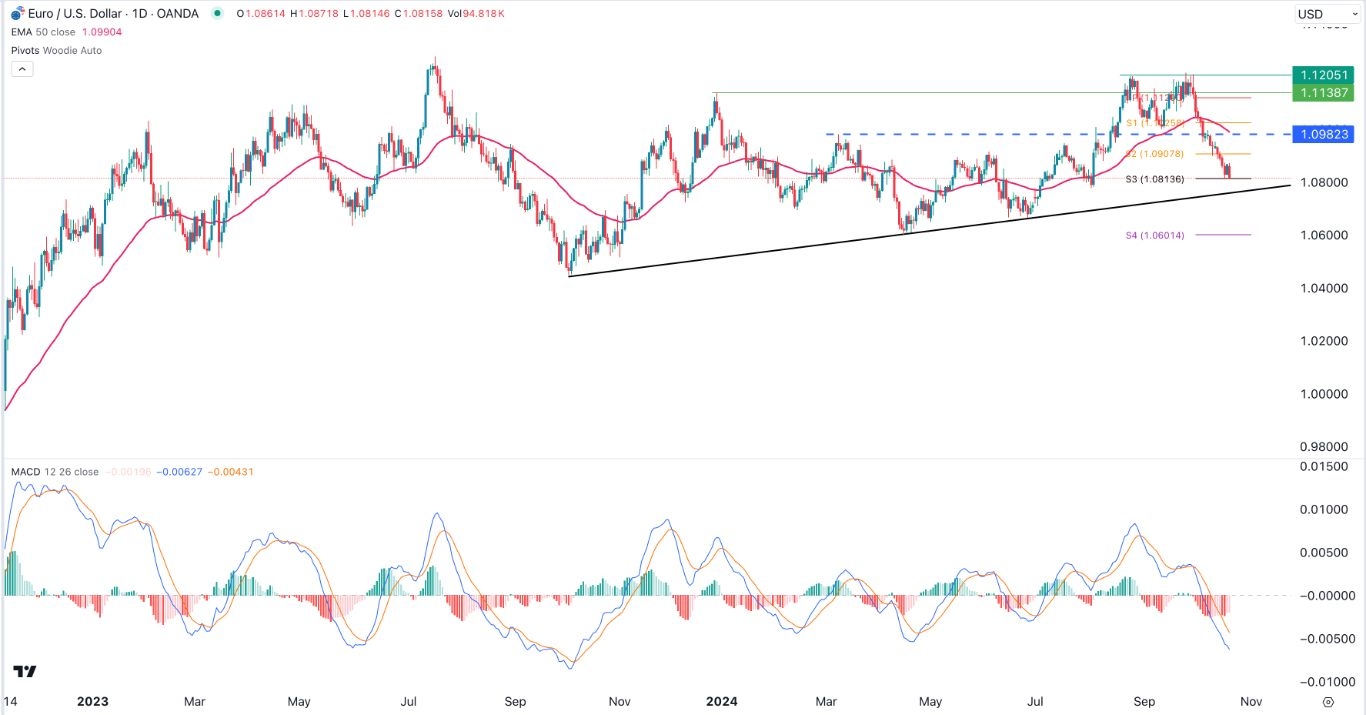
The EUR/USD exchange rate’s sell-off accelerated on Tuesday morning as the US dollar index continued its strong rally. It retreated to a low of 1.0816, its lowest point since August 2, and 3.56% below the year-to-date high of 1.1210.
ECB bankers speeches
The EUR/USD pair continued its strong sell-off as traders continued to reflect on last week’s European Central Bank (ECB) decision.
In it, officials decided to slash interest rates by 0.25% for the third consecutive meeting, bringing its benchmark rate to 3.25%.
The decision came on the same day that a report by Eurostat confirmed that the bloc’s inflation retreated below the 2% target in September. The headline Consumer Price Index (CPI) moved to 1.7%.
Therefore, analysts expect the ECB to maintain the rate cut momentum in the next few meetings since rmeetings since the economy was not doing well. Recent data showed that the bloc’s manufacturing and services PMIs continued contracting.
The next key EUR/USD pair will be key statements from key Federal Reserve and ECB officials like Patrick Harker, Christine Lagarde, and Elizabeth McCaul. These statements will likely provide more color on the next actions by the two central banks.
The pair has dropped because the ECB has become more dovish as some analysts question whether the Fed will cut interest rates in the next meeting.
EUR/USD technical analysis
The EUR/USD exchange pair has been in a strong downward trend since September 30th when it peaked at 1.1205.
This was an important peak since it coincided with the previous peak on August 26, forming a double-top pattern, a popular bearish sign. As a result, many EUR/USD predictions now point towards further downside potential.
The pair has also moved below the 50-day Exponential Moving Average at 1.0990. Another notable crossover was at 1.0982, its highest swing on March 8 this year, reinforcing the bearish outlook.
Meanwhile, it has moved to the third support of the Woodie pivot point at 1.0813. Most oscillators like the MACD and the Money Flow Index (MFI) have all pointed downwards.
Therefore, the pair will likely continue falling as traders target the ascending trendline that connects the lowest swings since Oct. 4. A drop below that point will confirm the bearish trend and point to more weakness, with the next point to watch being at 1.0600, the fourth support of the Woodie point.
The alternative scenario is for it to retest the ascending trendline and then bounce back as investors start to buy the dip.
More By This Author:
BTC/USD Forex Signal: Bullish Momentum To AccelerateRYLD Yields 12%, IWM 1.1%: Which Is The Better Russel 2000 ETF?
GBP/USD Forex Signal: Wedge Pattern Points To More Downside
Disclosure: DailyForex will not be held liable for any loss or damage resulting from reliance on the information contained within this website including market news, analysis, trading signals ...
more


