EUR/USD Falls Into 1.0660 As Greenback Bolstered By Fed

Image Source: Pixabay
- The EUR/USD has rapidly reversed Wednesday's direction after getting knocked lower by the Fed rate call.
- Fed keeps rates at 5.5% but sees at least one more rate hike by the end of 2023.
- Markets have piled into the USD after the Fed updated its forward-looking rate expectations.
The EUR/USD is sharply off the day's highs of 1.0735, trading into the low end and chalking in a new low for Wednesday near 1.0650.
The Federal Reserve (Fed) updated its Summary of Projections (SEP), which shows Fed officials expecting the interest rate to hit 5.1% by the end of 2024 (previously 4.6%). Despite the Fed holding steady on rates at 5.5% for the time being, the uptick in the rate of interest rate cuts has sent the US Dollar broadly up across the board.
Up next on the economic calendar, US Initial Jobless Claims are slated for Thursday at 12:30 GMT, and the figure is expected to print slightly higher at 225K versus the previous 220K.
Friday sees Purchasing Manager Index (PMI) figures for both the European Union (EU) and the US. EU Composite PMI is forecast to dip slightly to 46.5 from 46.7, while the US side is anticipating a minor improvement. The US Manufacturing PMI is expected to tick up from 47.9 to an even 48.0, while the Services component is anticipated at 50.6 versus the previous 50.5.
EUR/USD technical outlook
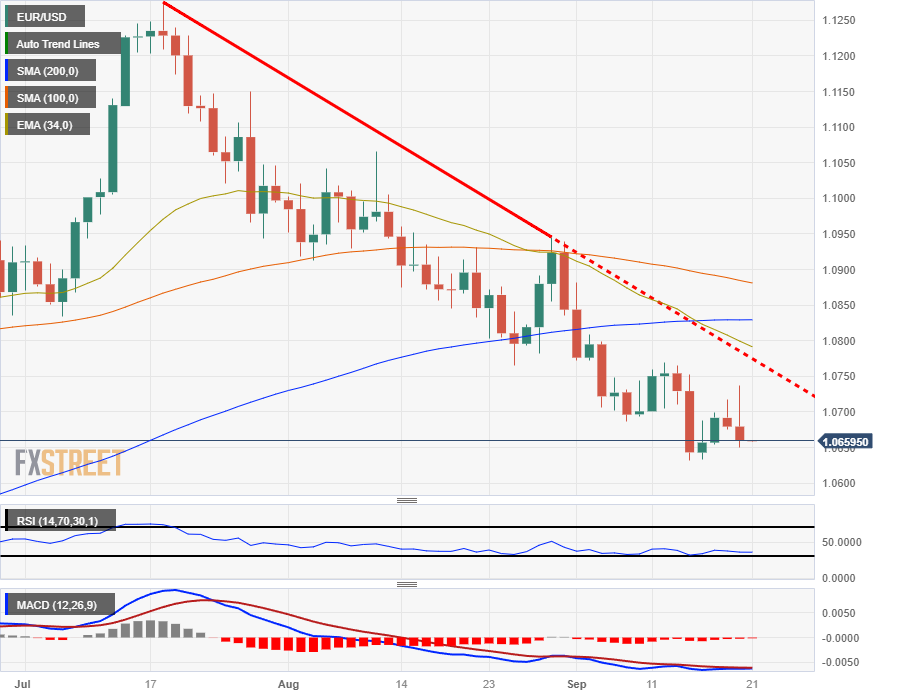
Wednesday's Fed-sponsored decline in the Euro-Dollar pairing sees the EUR/USD giving up most of the gains for the week, trading into the 1.0660 level after getting knocked back.
Price declines in the pair are starting to accelerate from a descending trendline on the daily candlesticks, marked in from July's swing high near 1.250.
The 200-day Simple Moving Average (SMA) also rests above the current price action, turning flat near 1.0830.
Continued selling pressure from here will see the EUR/USD set to close in the red for a tenth straight week and set to challenge the year's lows currently marked in near 1.0500.
EUR/USD daily chart
(Click on image to enlarge)

EUR/USD technical levels
EUR/USD
| OVERVIEW | |
|---|---|
| Today last price | 1.066 |
| Today Daily Change | -0.0020 |
| Today Daily Change % | -0.19 |
| Today daily open | 1.068 |
| TRENDS | |
|---|---|
| Daily SMA20 | 1.0763 |
| Daily SMA50 | 1.0918 |
| Daily SMA100 | 1.0889 |
| Daily SMA200 | 1.0829 |
| LEVELS | |
|---|---|
| Previous Daily High | 1.0718 |
| Previous Daily Low | 1.0675 |
| Previous Weekly High | 1.0769 |
| Previous Weekly Low | 1.0632 |
| Previous Monthly High | 1.1065 |
| Previous Monthly Low | 1.0766 |
| Daily Fibonacci 38.2% | 1.0691 |
| Daily Fibonacci 61.8% | 1.0702 |
| Daily Pivot Point S1 | 1.0664 |
| Daily Pivot Point S2 | 1.0648 |
| Daily Pivot Point S3 | 1.0621 |
| Daily Pivot Point R1 | 1.0707 |
| Daily Pivot Point R2 | 1.0734 |
| Daily Pivot Point R3 | 1.075 |
More By This Author:
USD/CAD Climbs As Fed Signals 5% In 2024, Amid Powell’s Hawkish RemarksNZD/USD Soars To Monthly Highs Above 0.5980, Weak USD
GBP/JPY Stuck Near 183.00 After UK CPI Disappoints
Disclaimer: Information on these pages contains forward-looking statements that involve risks and uncertainties. Markets and instruments profiled on this page are for informational purposes only ...
more


